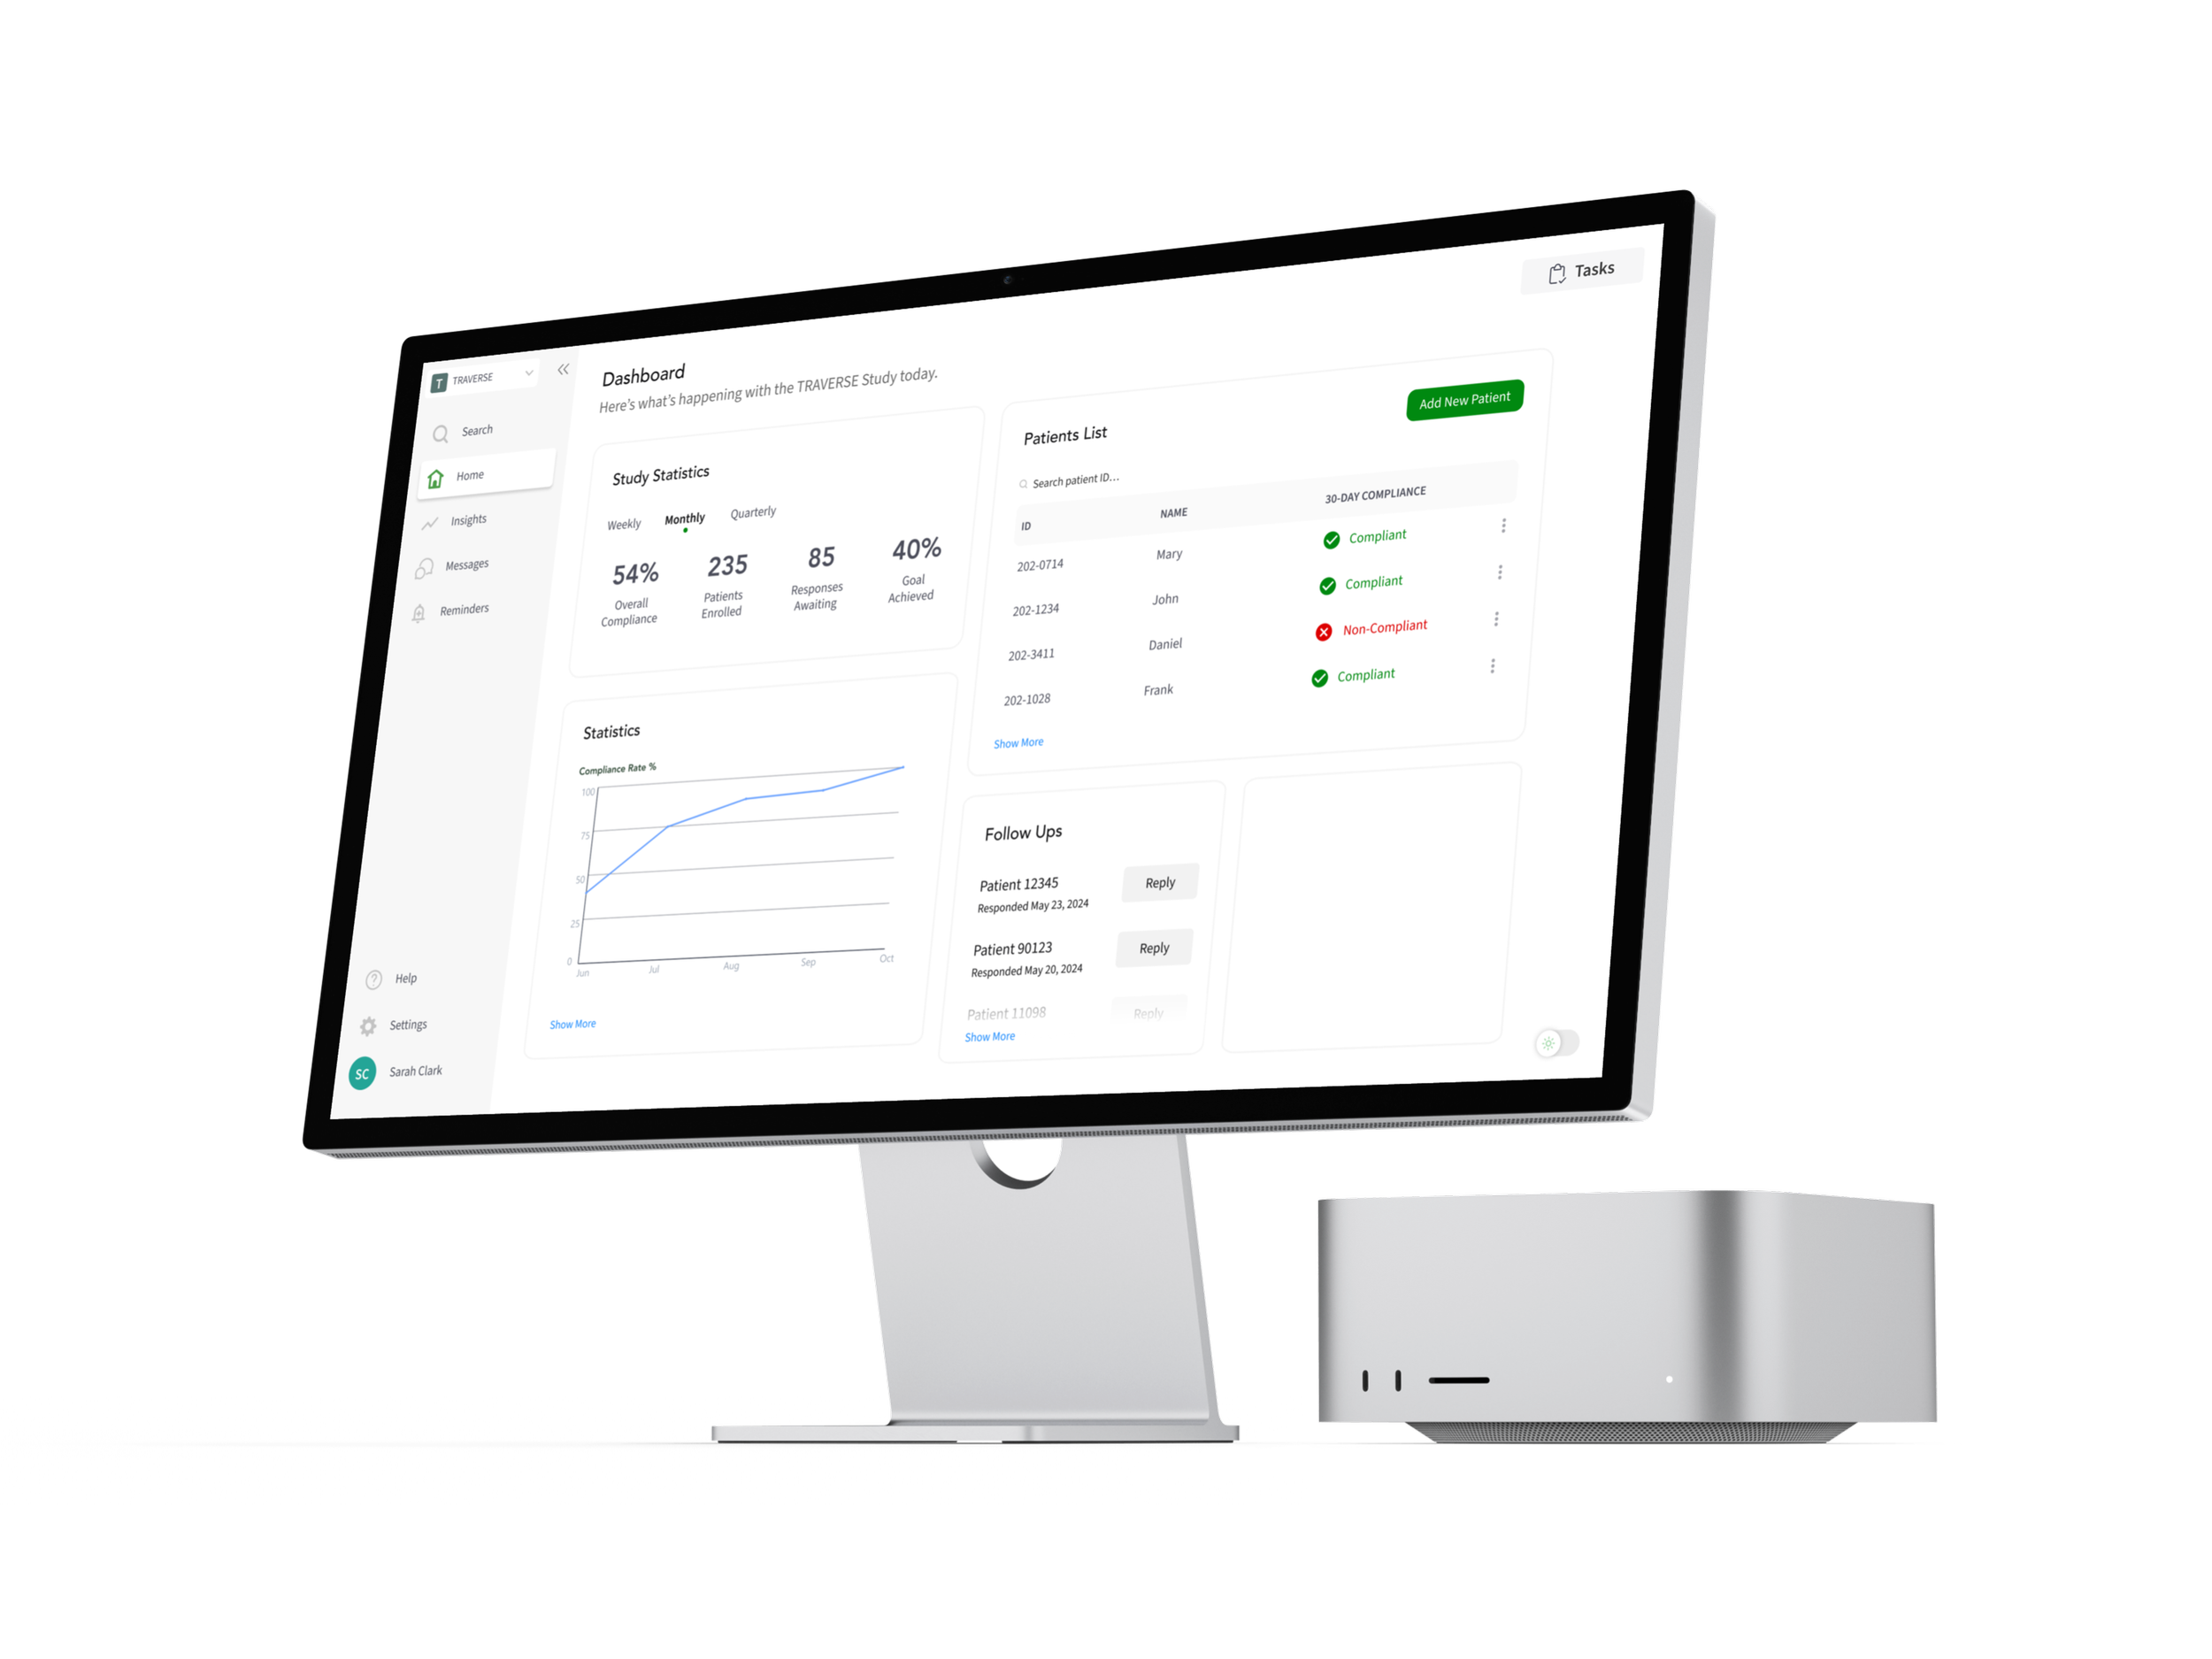
Dashboard 2.0
Streamlining daily navigation of the dashboard to shift attention towards priority actions for clinical research teams
UX/UI
Web
Dashboard
Project Overview
METHODS & TOOLS
Sketching
Research
Prototyping
Adobe XD, Figma
DELIVERABLES
User Flow
Wireframes
Mid and Hi-Fidelity Prototypes
PLATFORM
Web
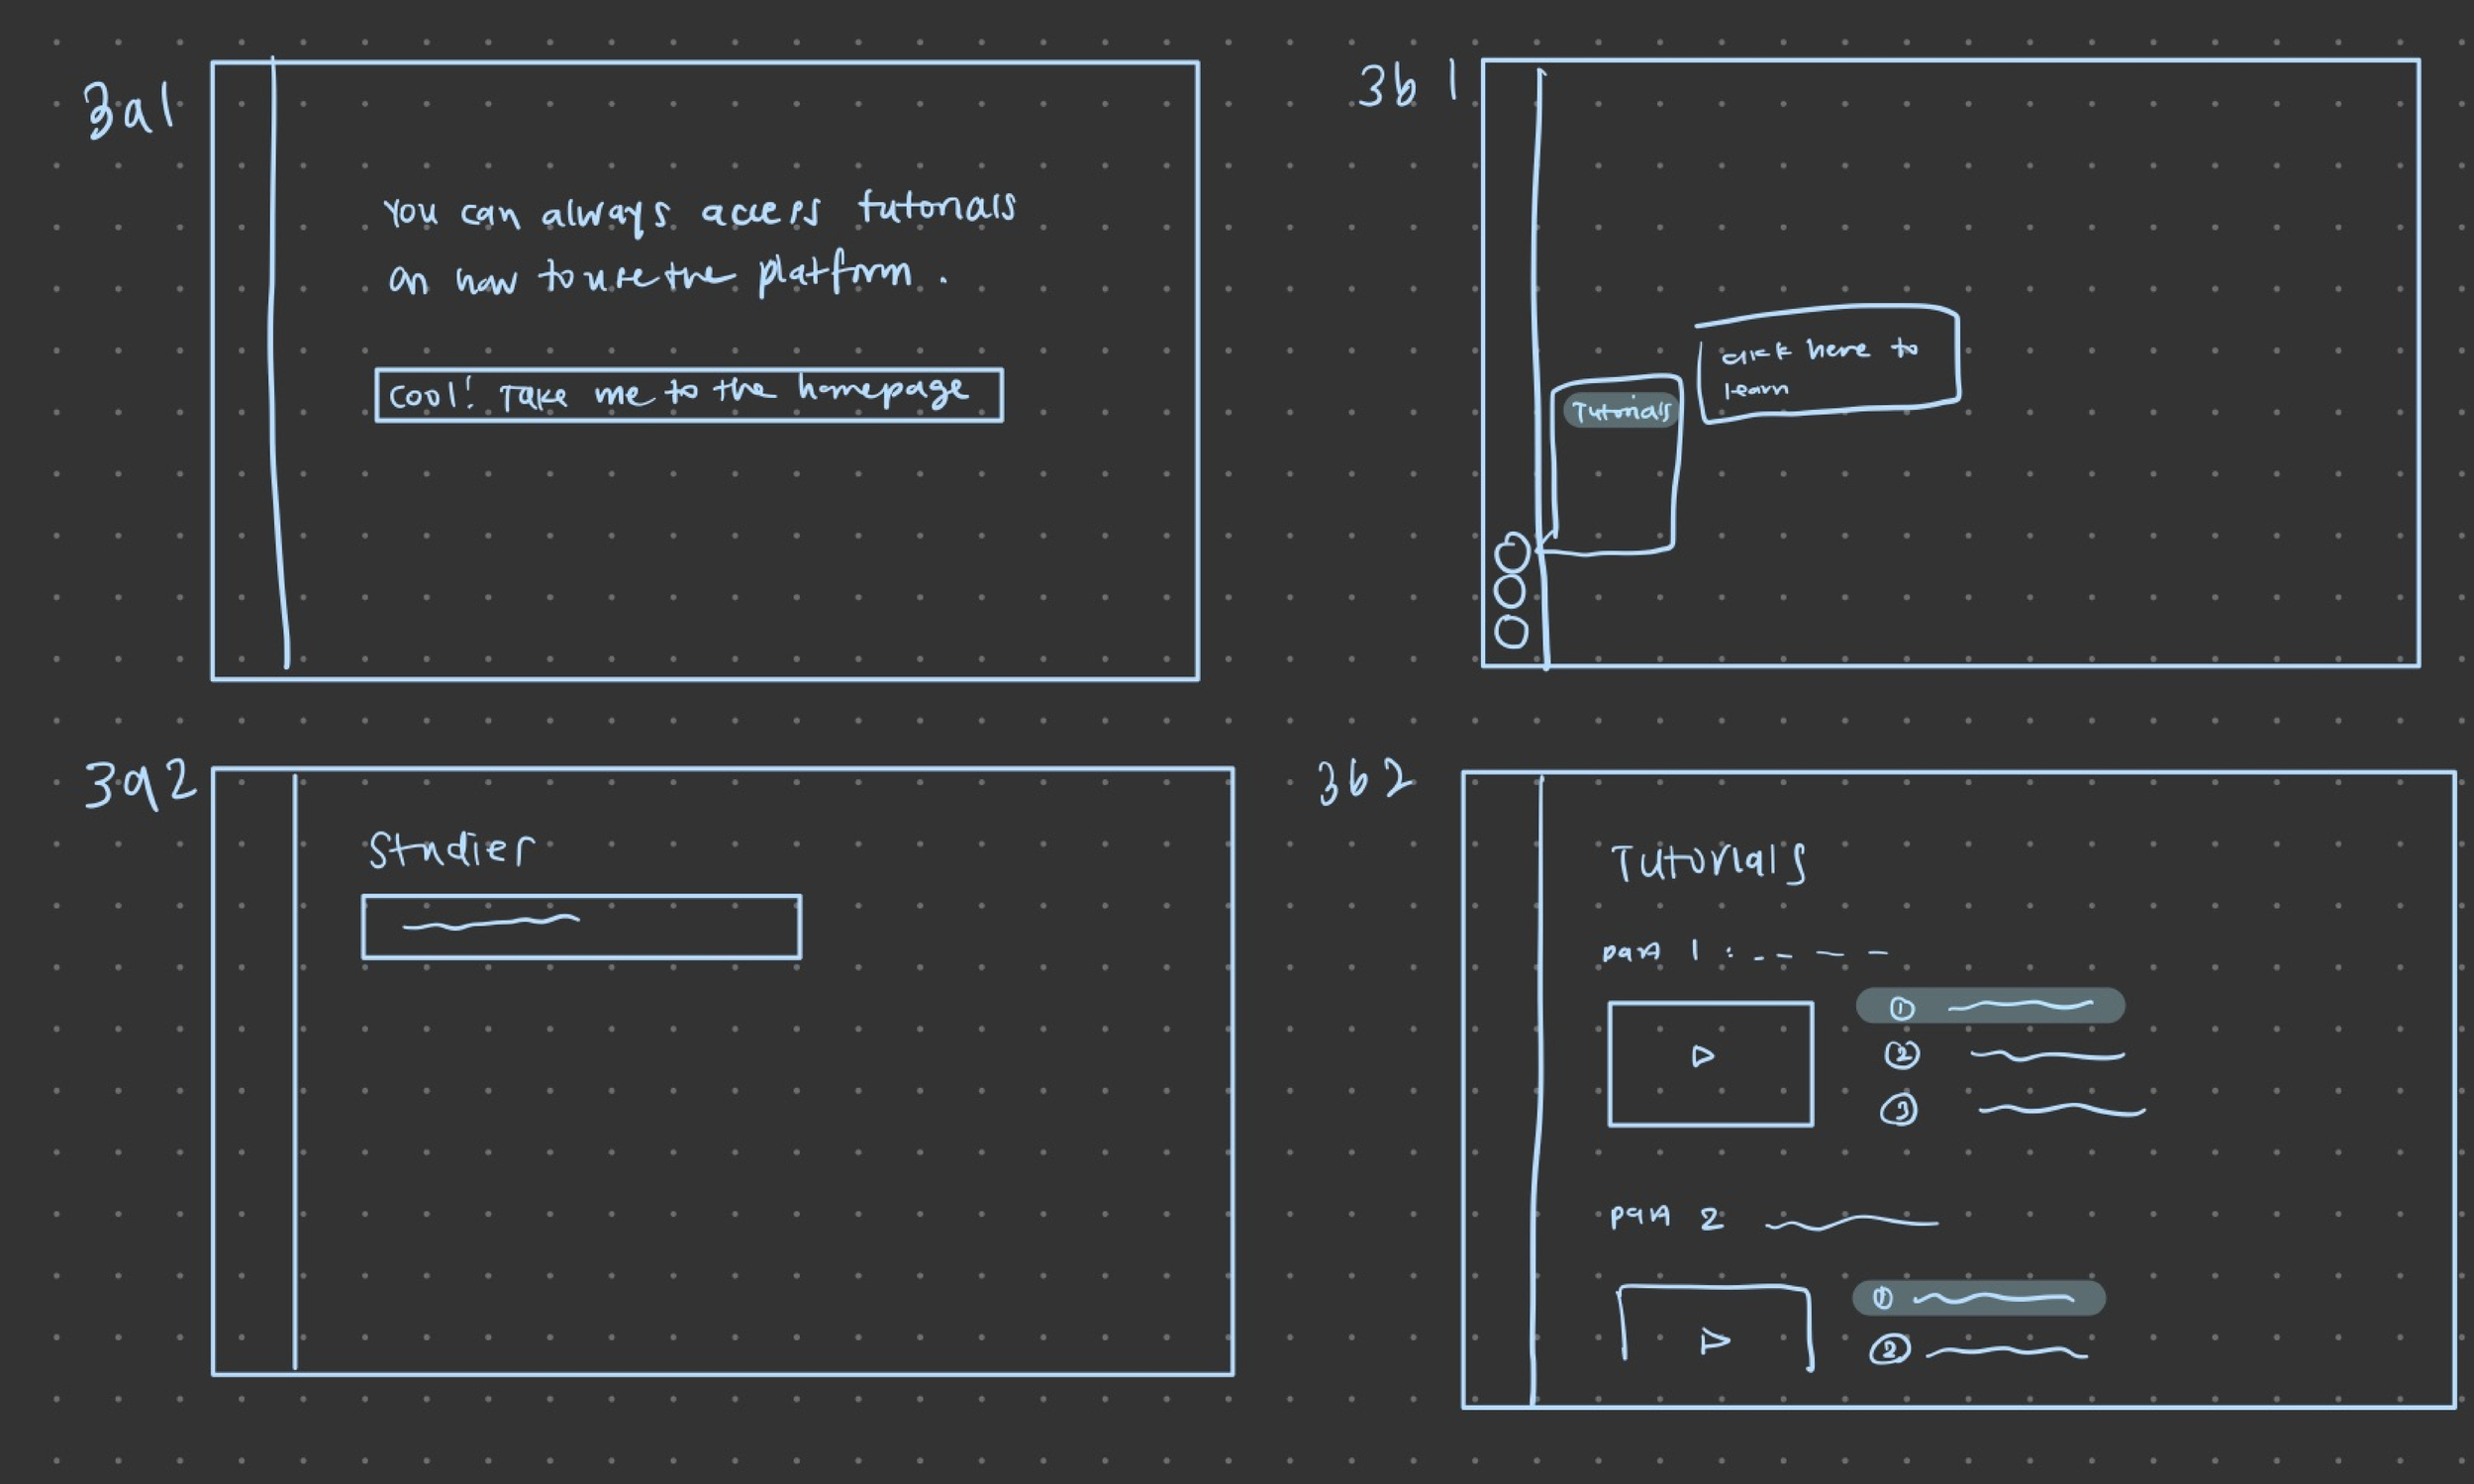
Sketch & Ideate

From the beginning of the project and throughout, I sketched out wireframes and flows to capture layouts and UX flow to generate early-stage feedback from my team to set a design direction.

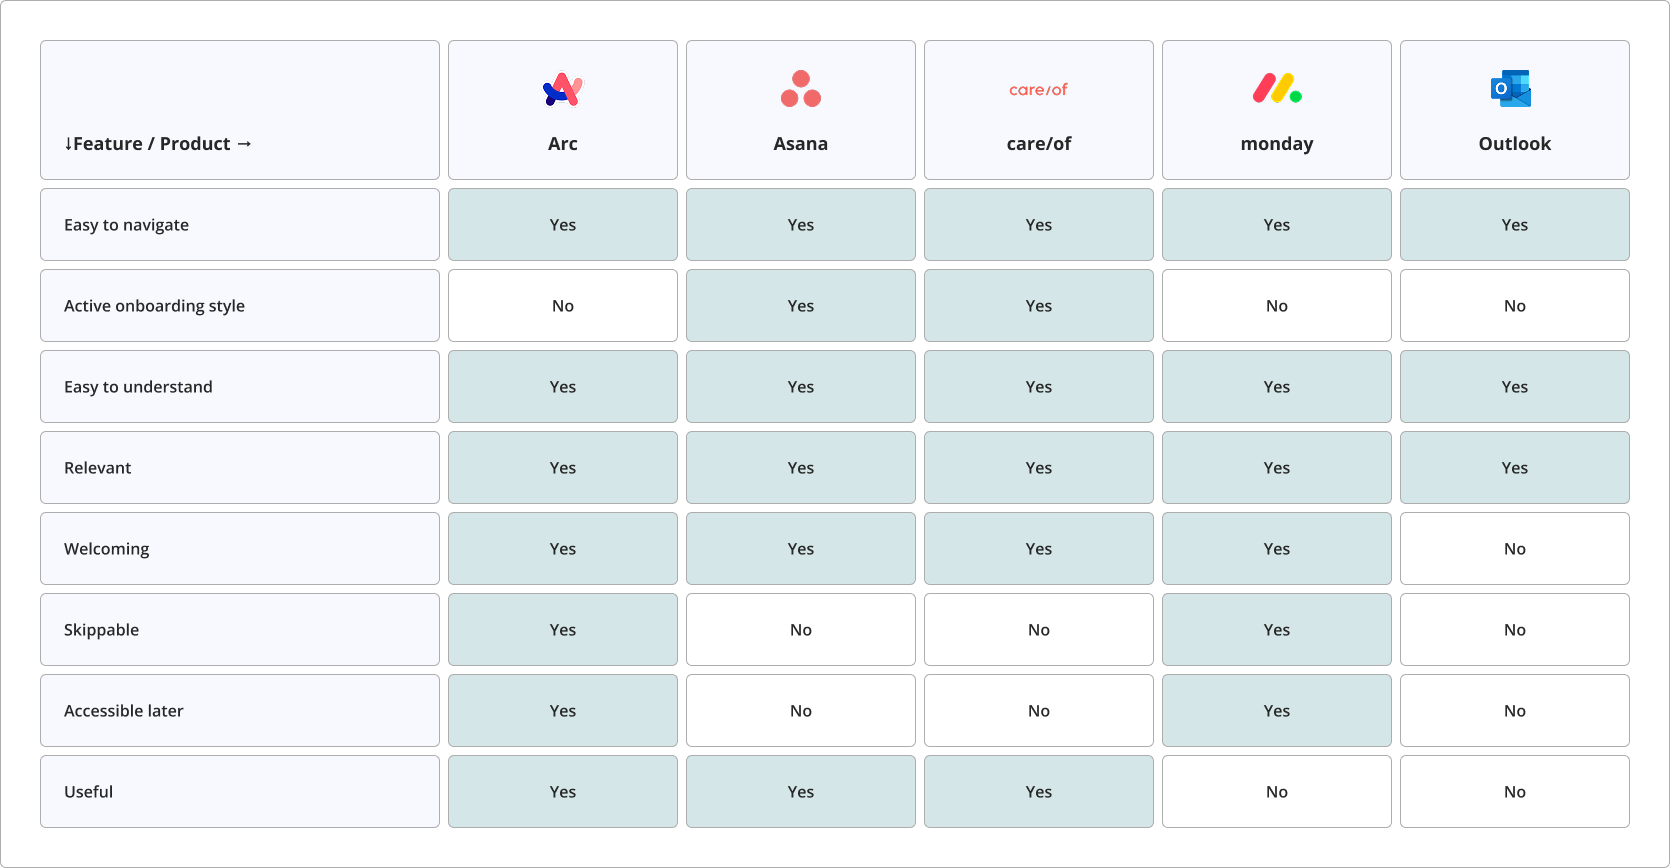
Analyzing Competitors
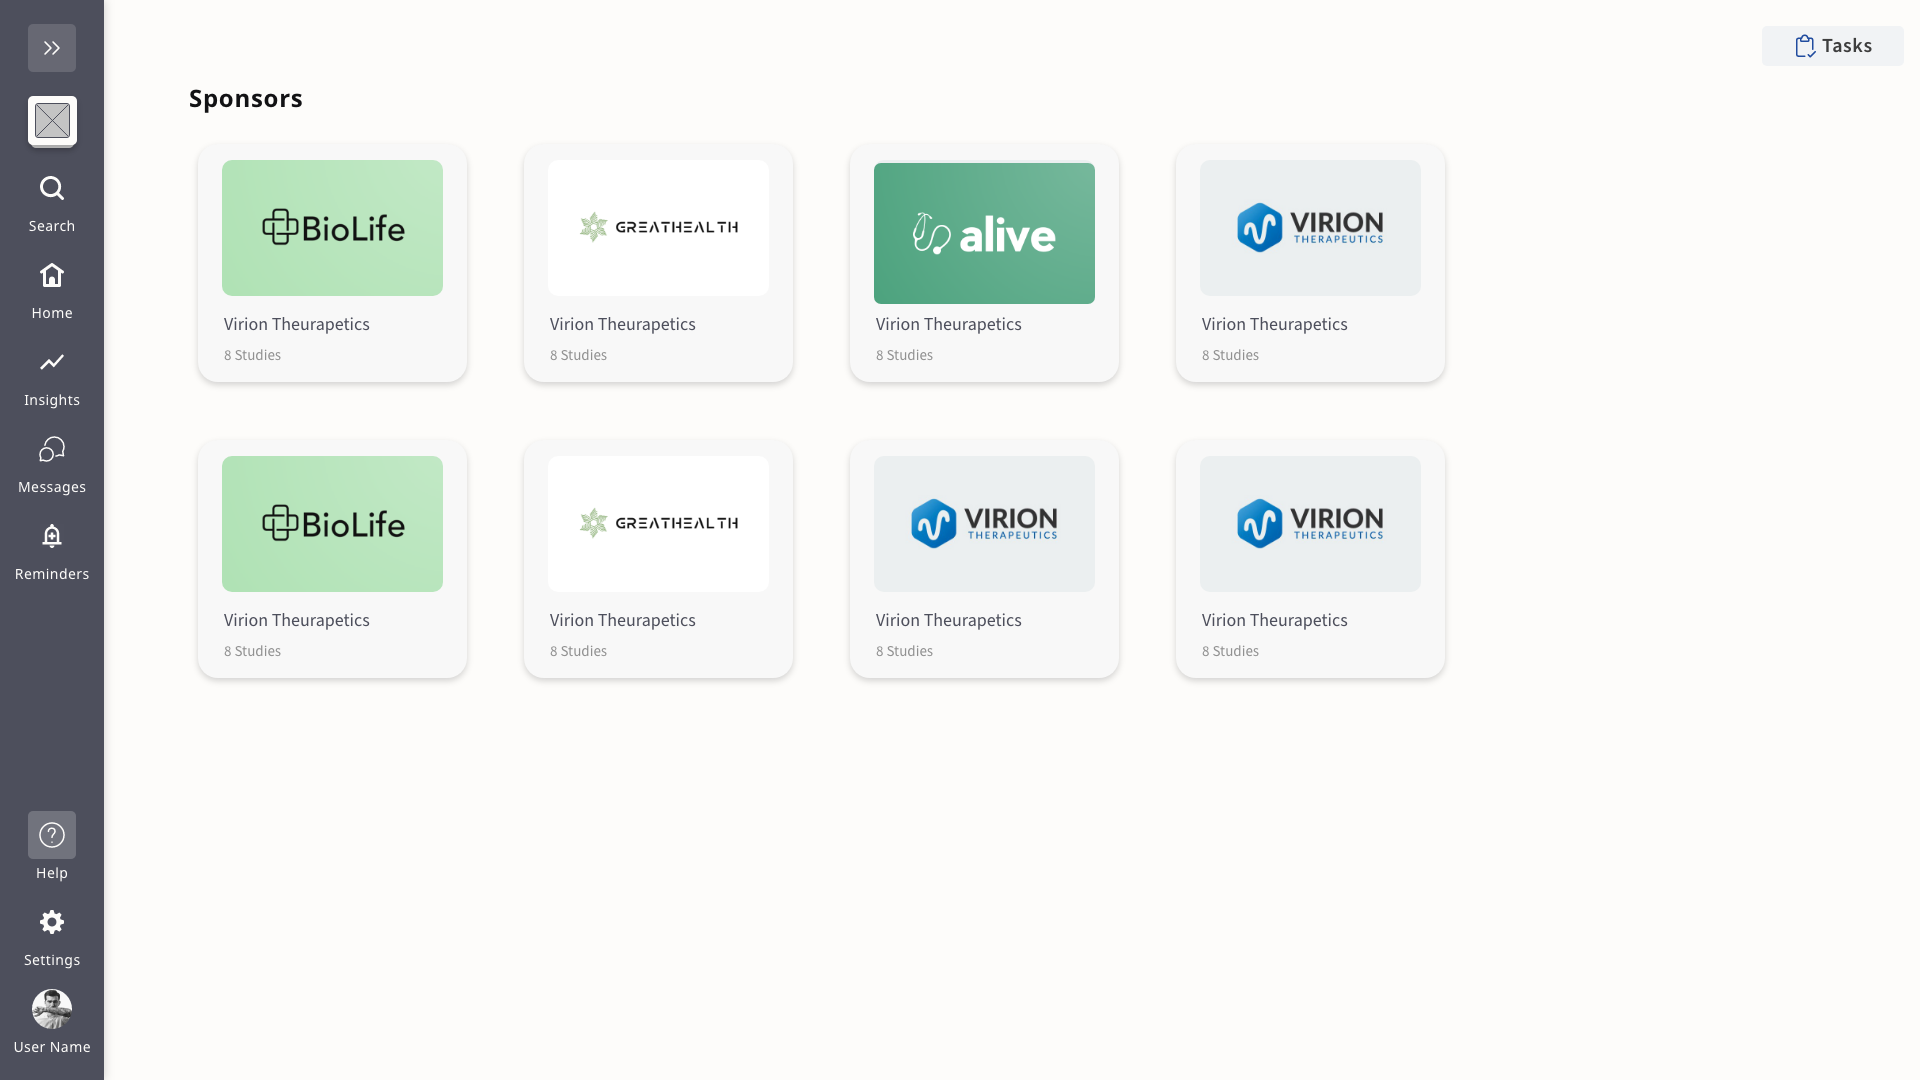
Through detailed research on how other companies present various features and flows in their products, such as onboarding, menus, side drawers, task lists, multi-tenancy, and help/resources, I was able to uncover strengths and weaknesses and identify opportunities for developing new features in our dashboard.
Some Deep Dive Highlights
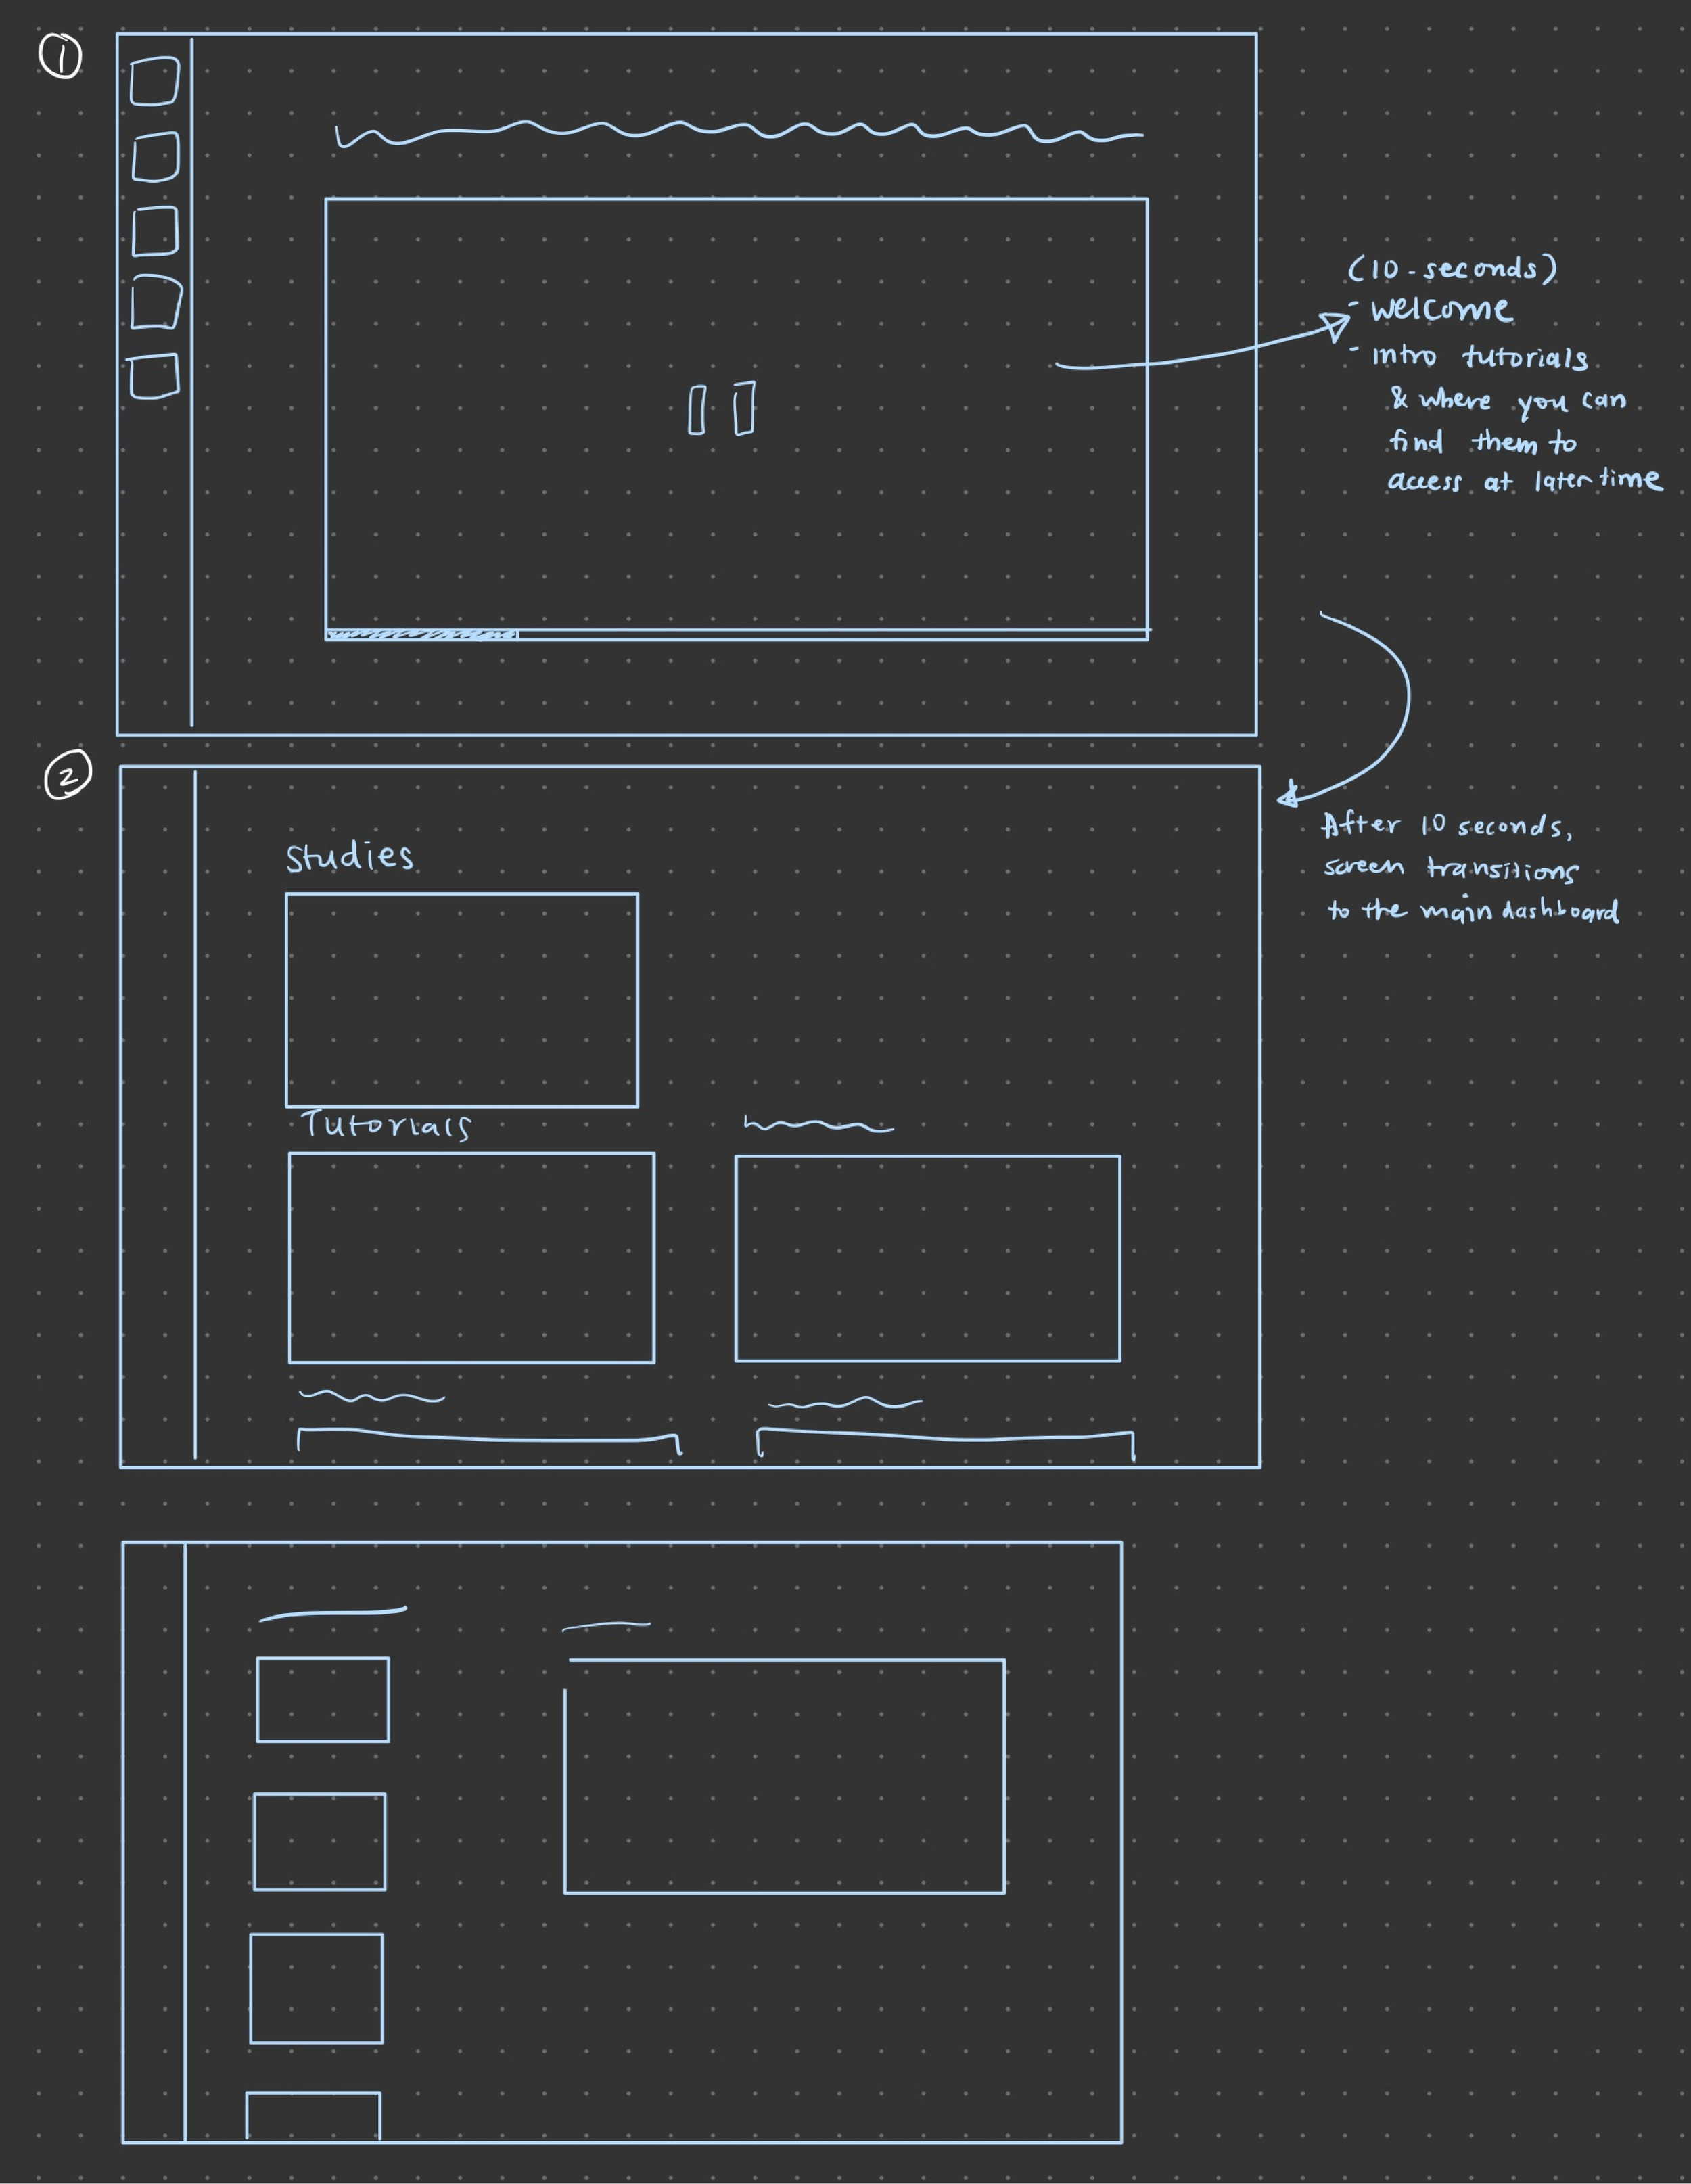
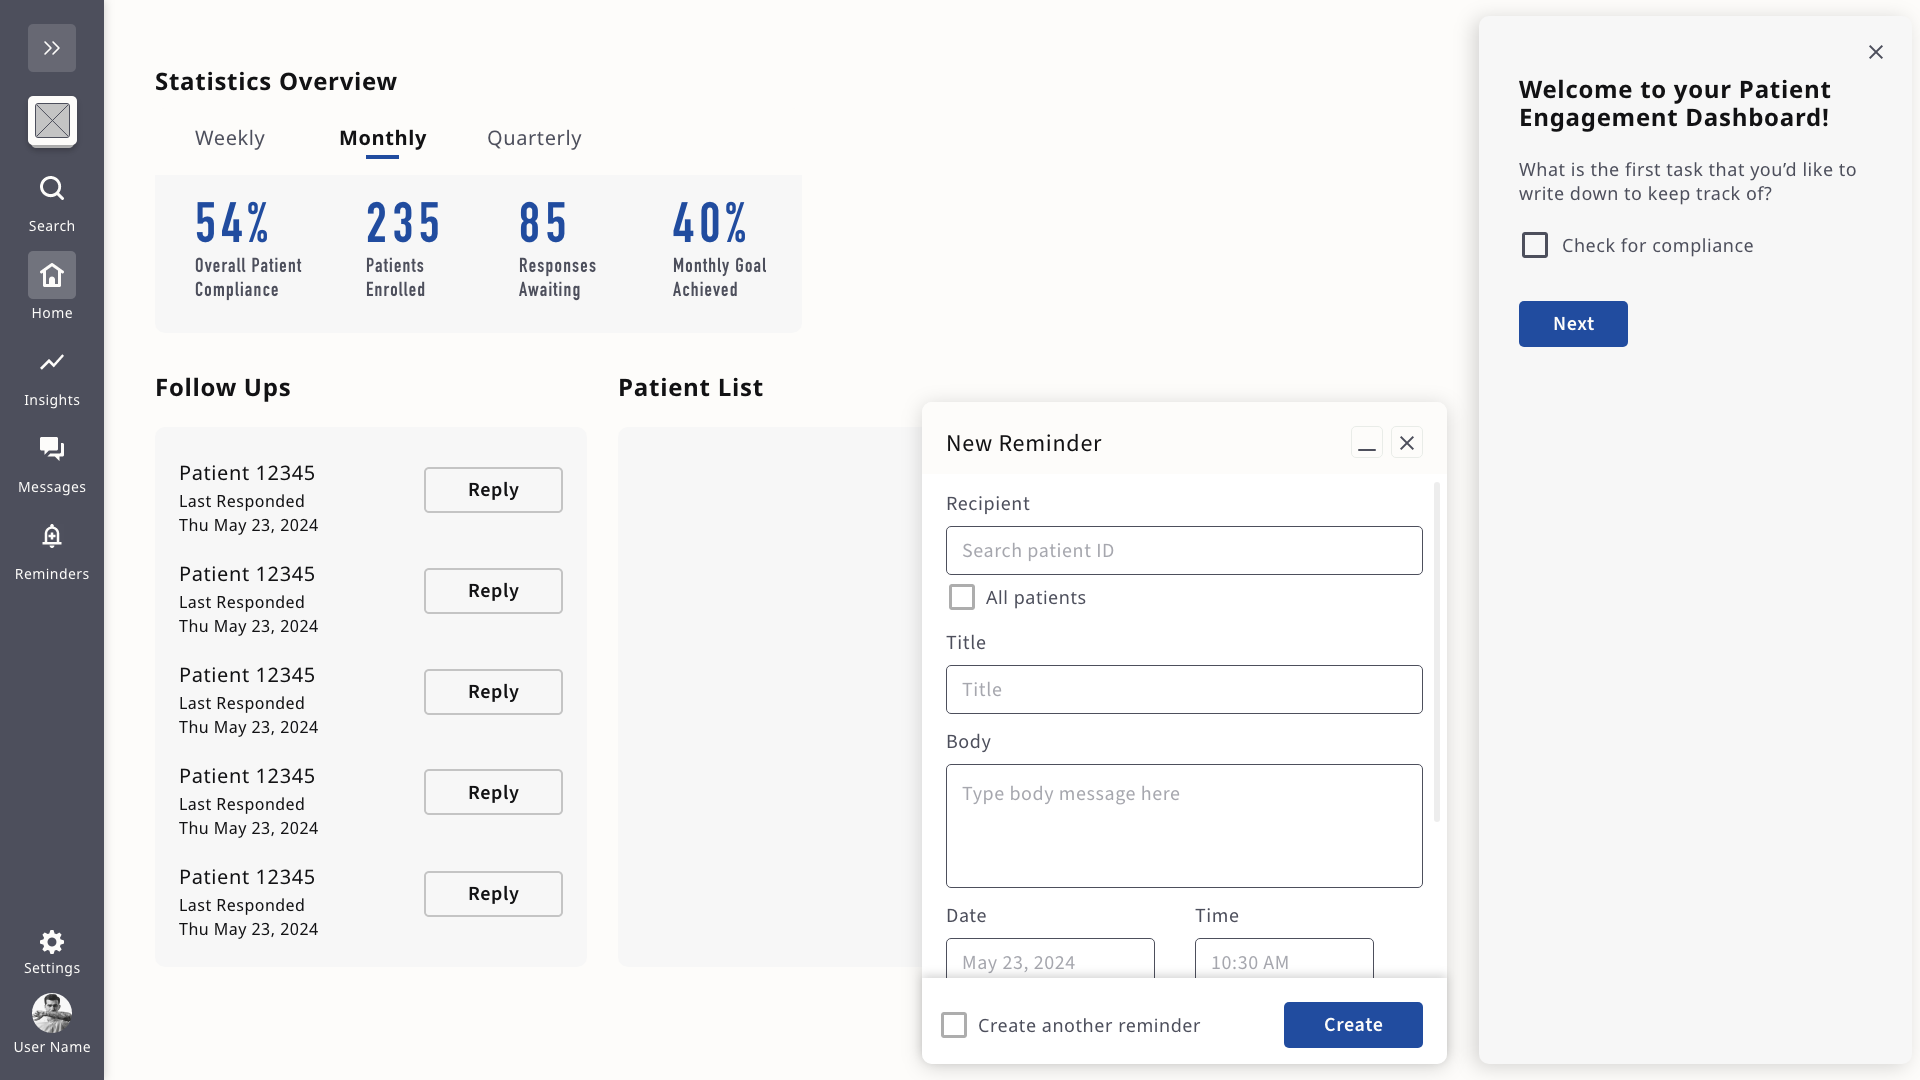
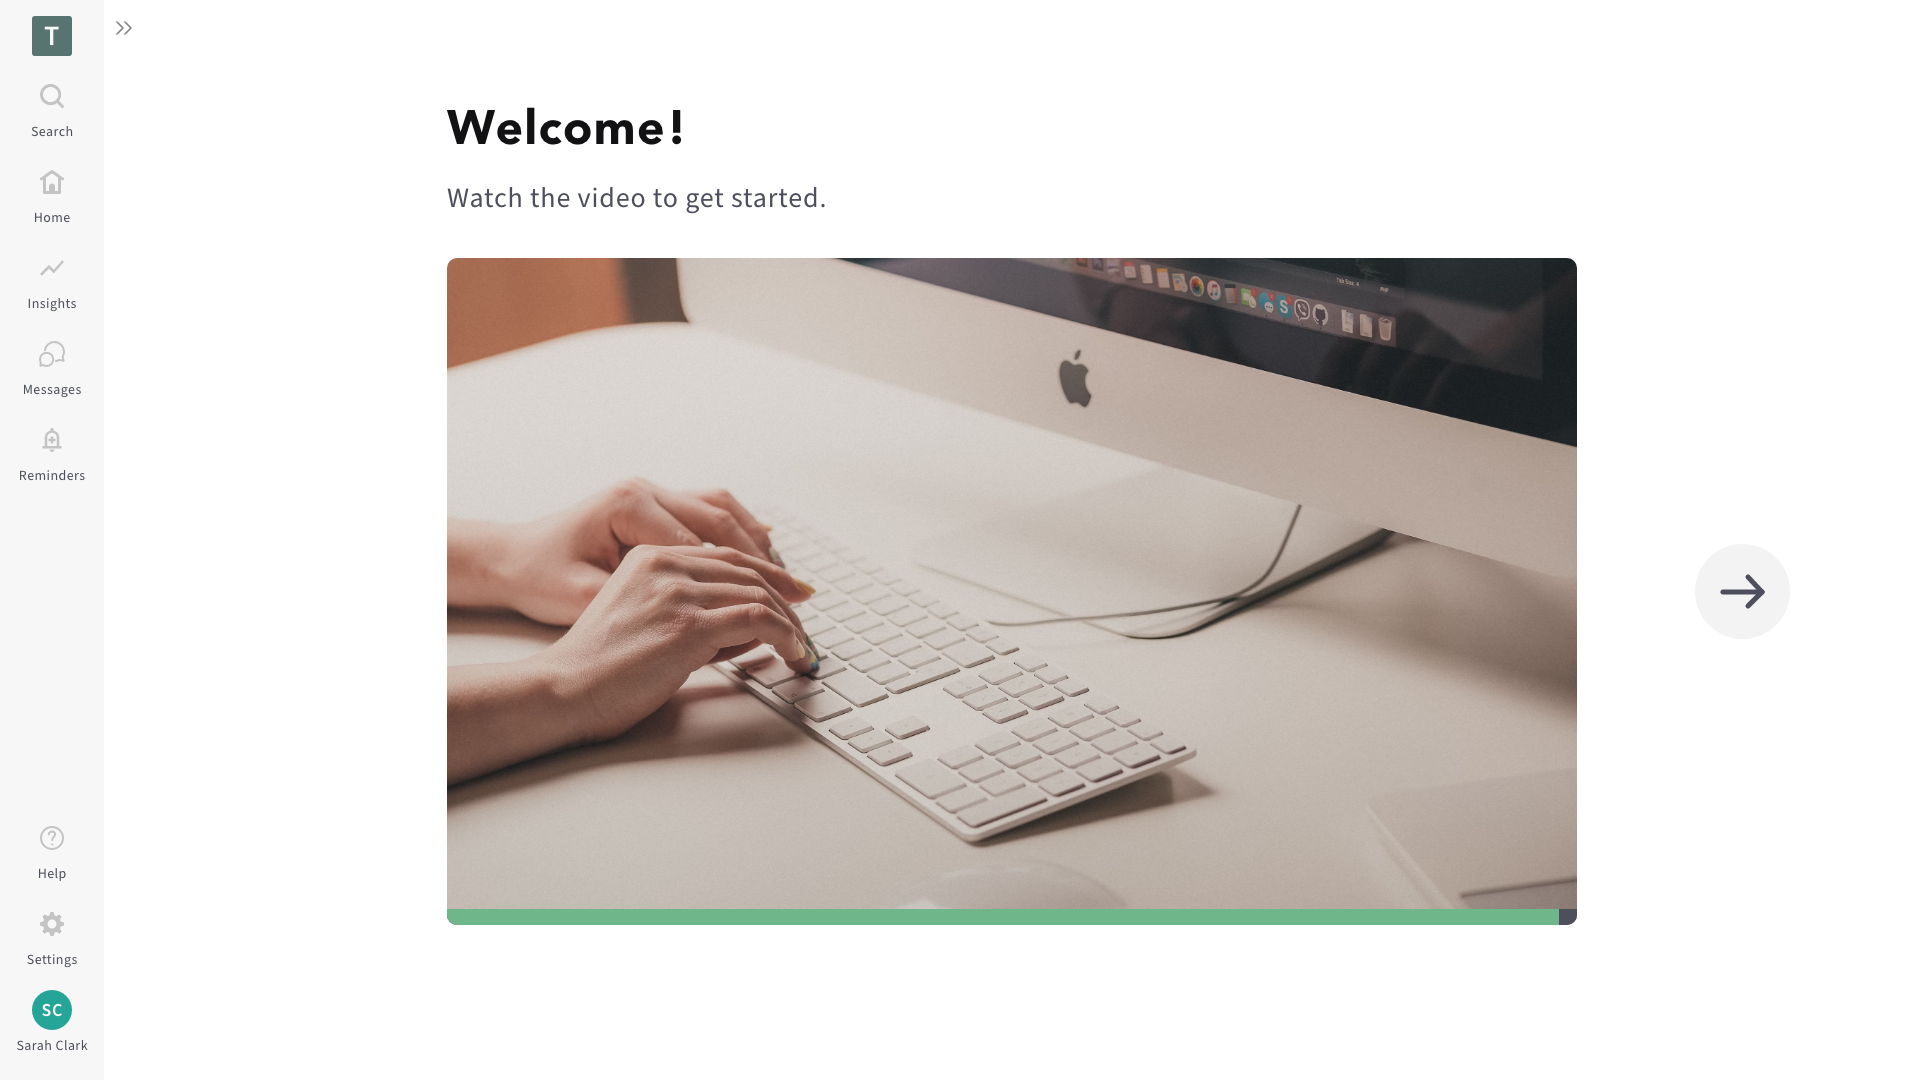
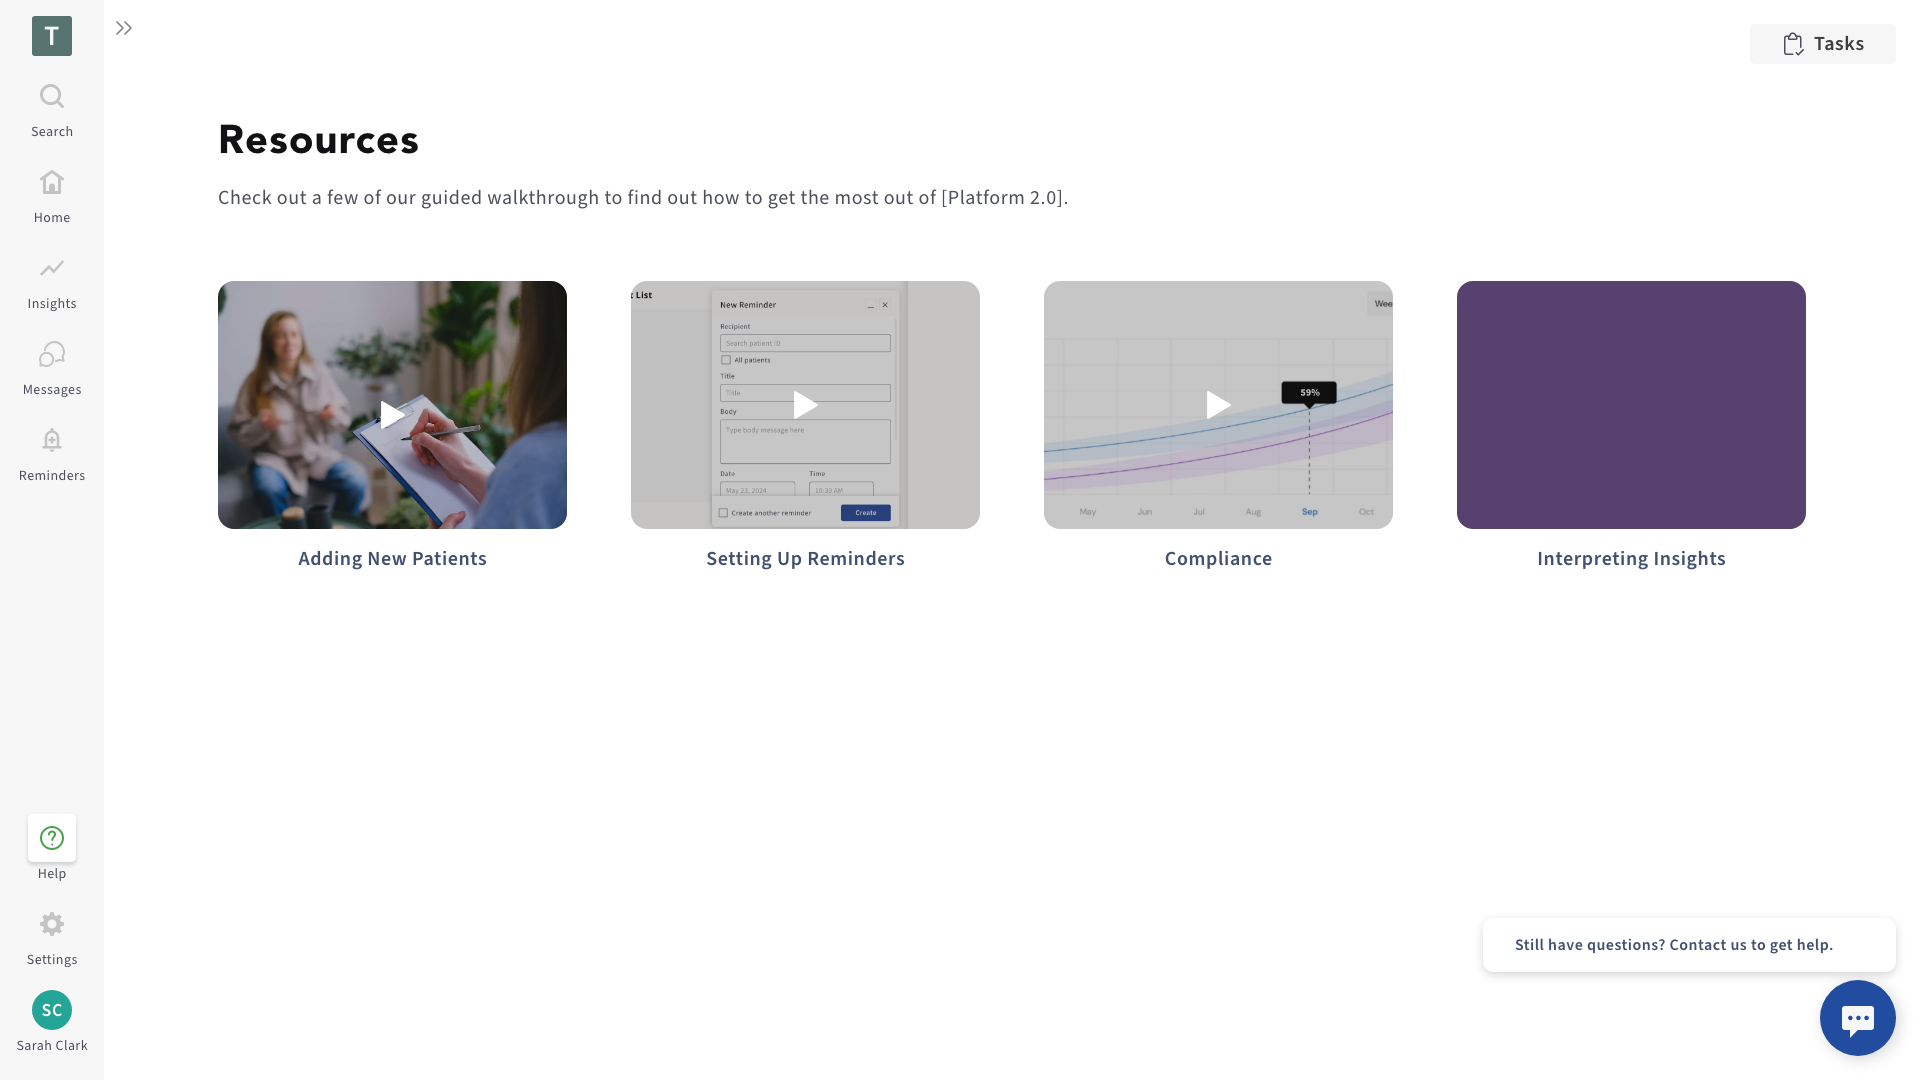
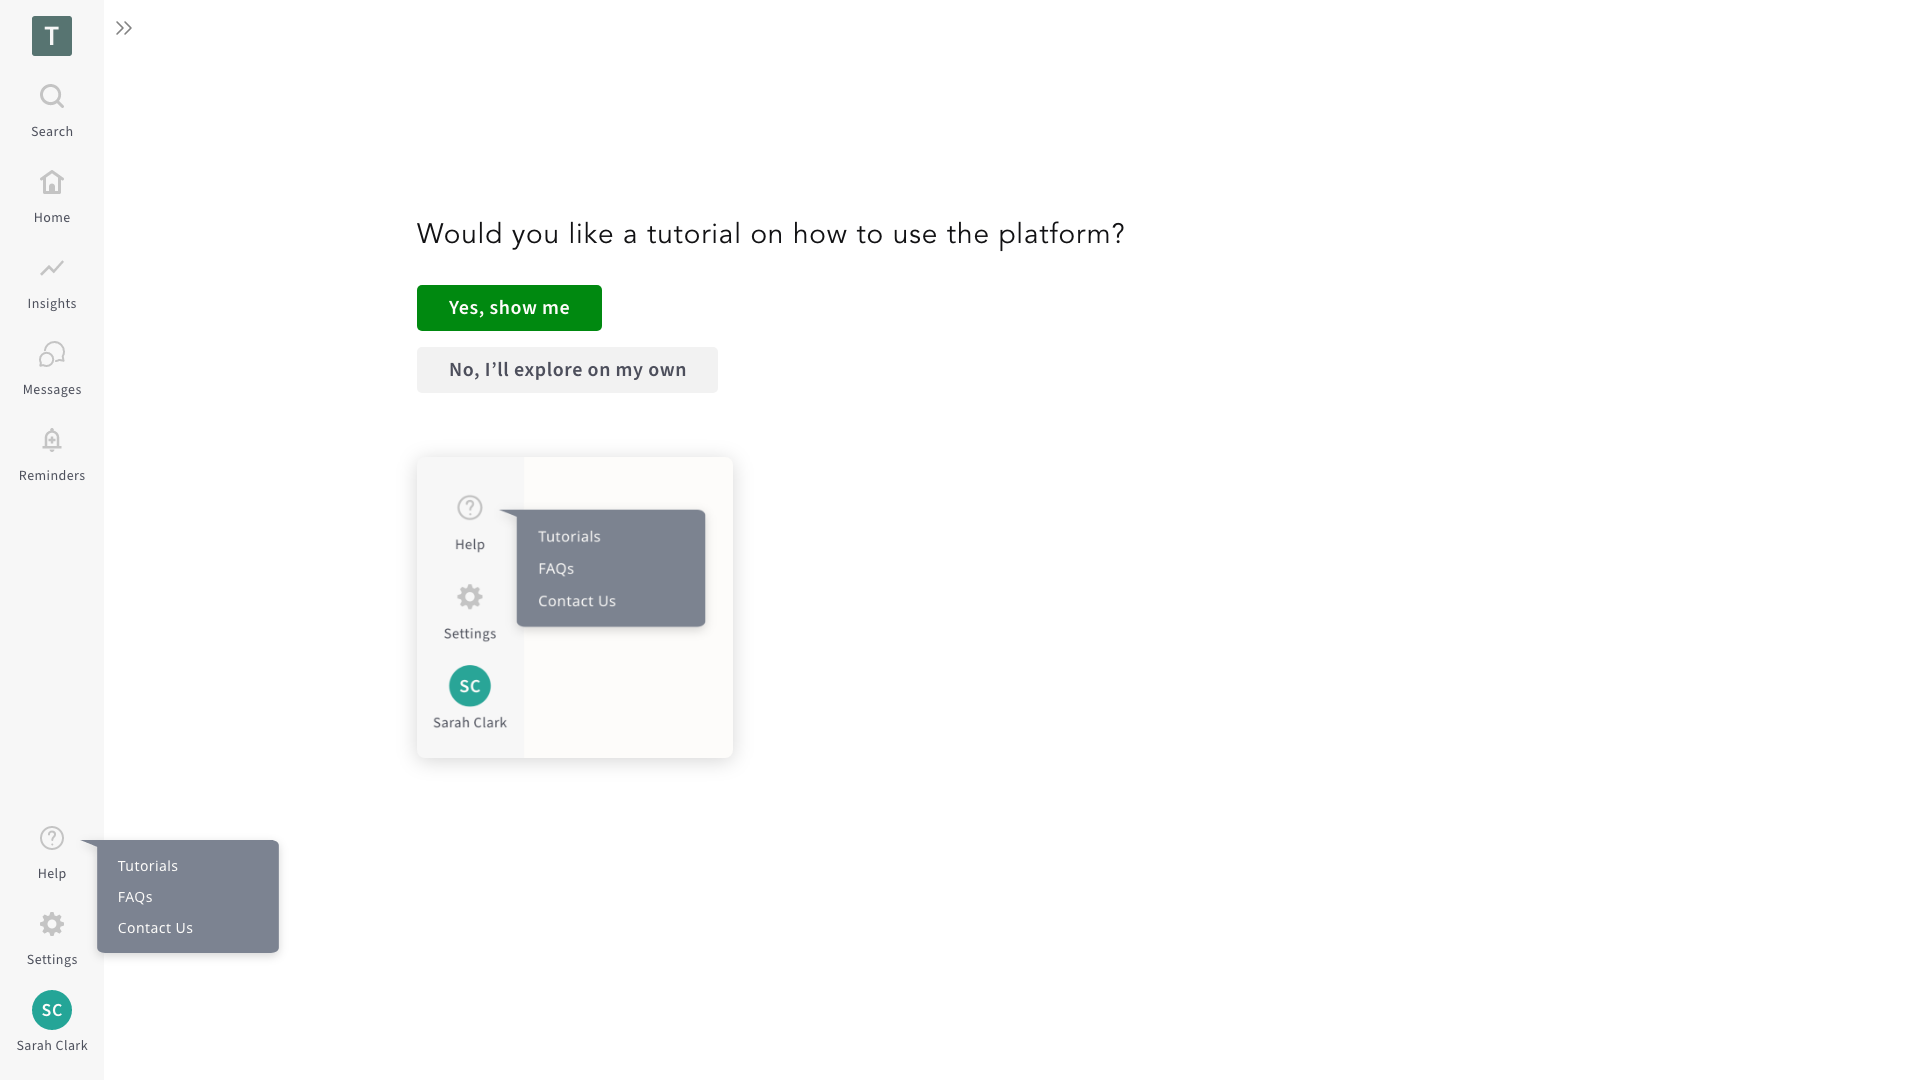
Onboarding Flow
Annotations, pros/cons and conclusion of my thoughts on the UX/UI
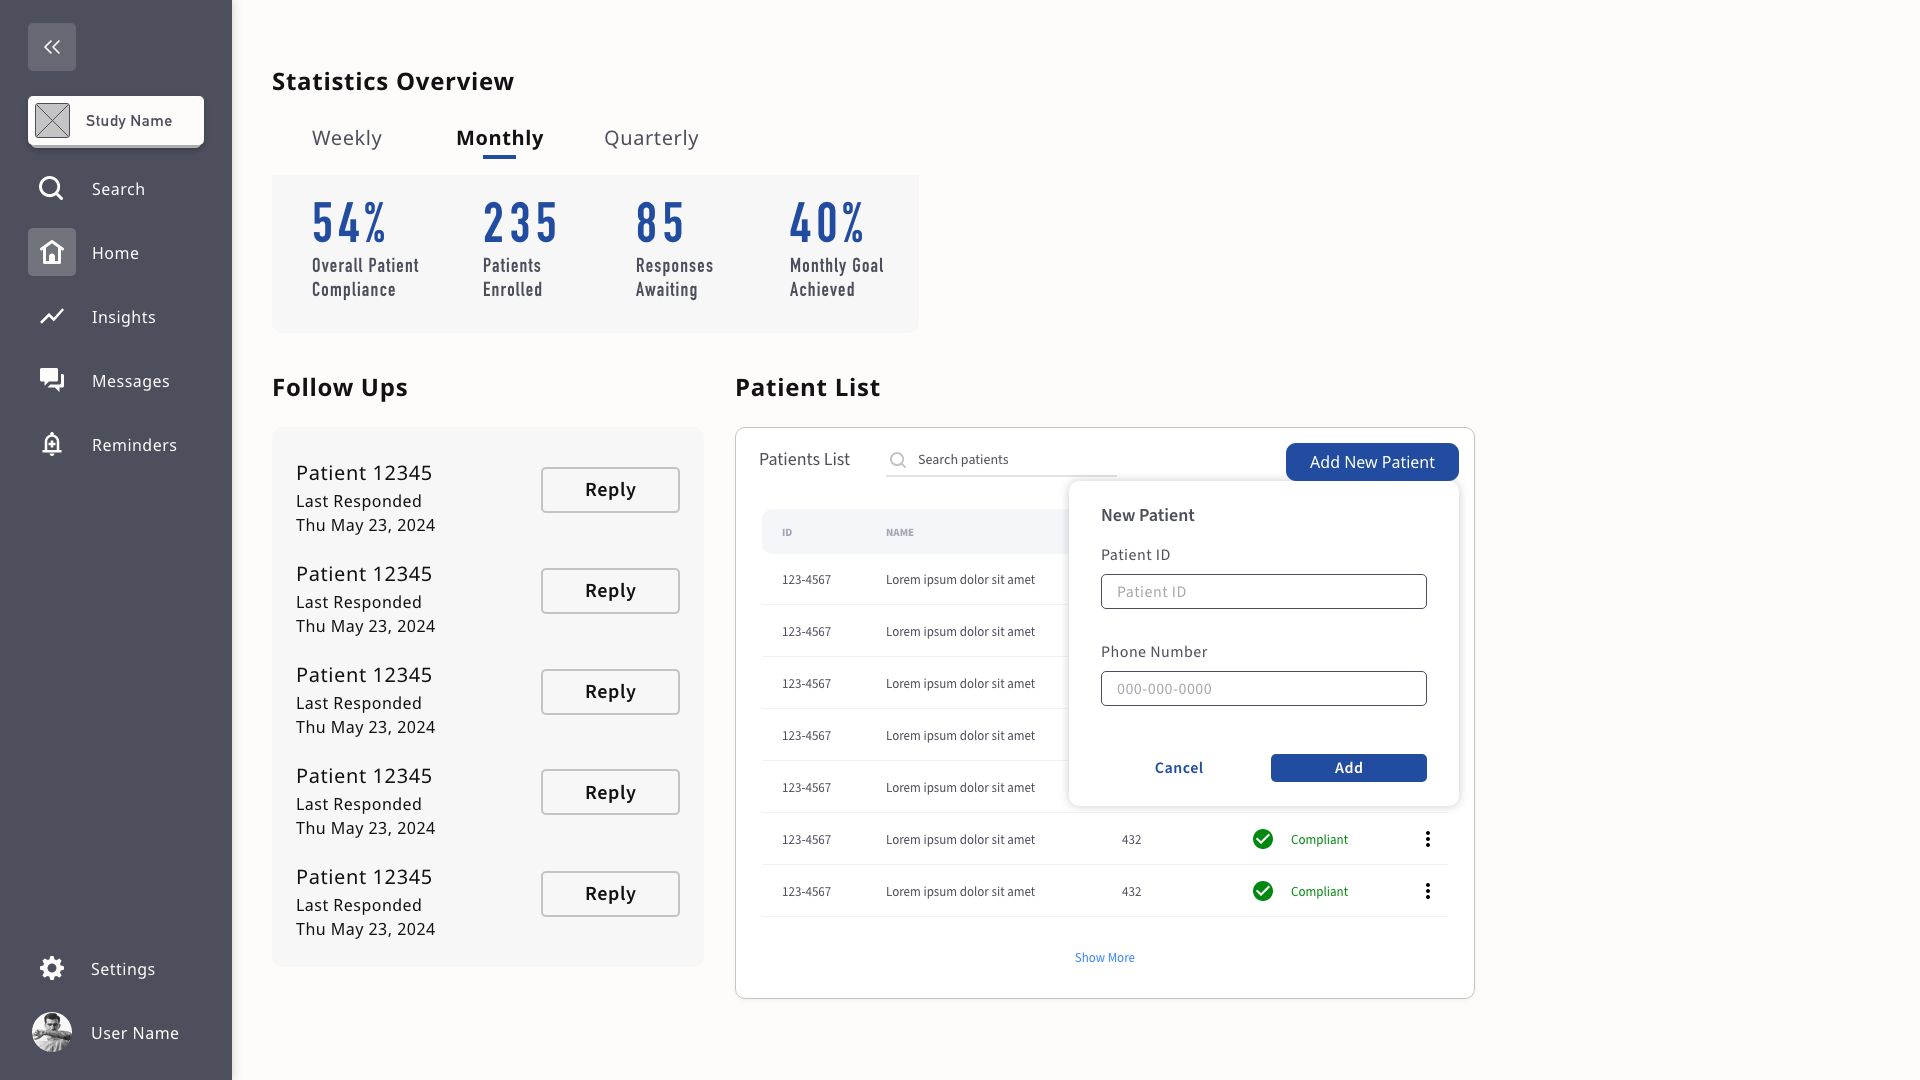
Menu Feature
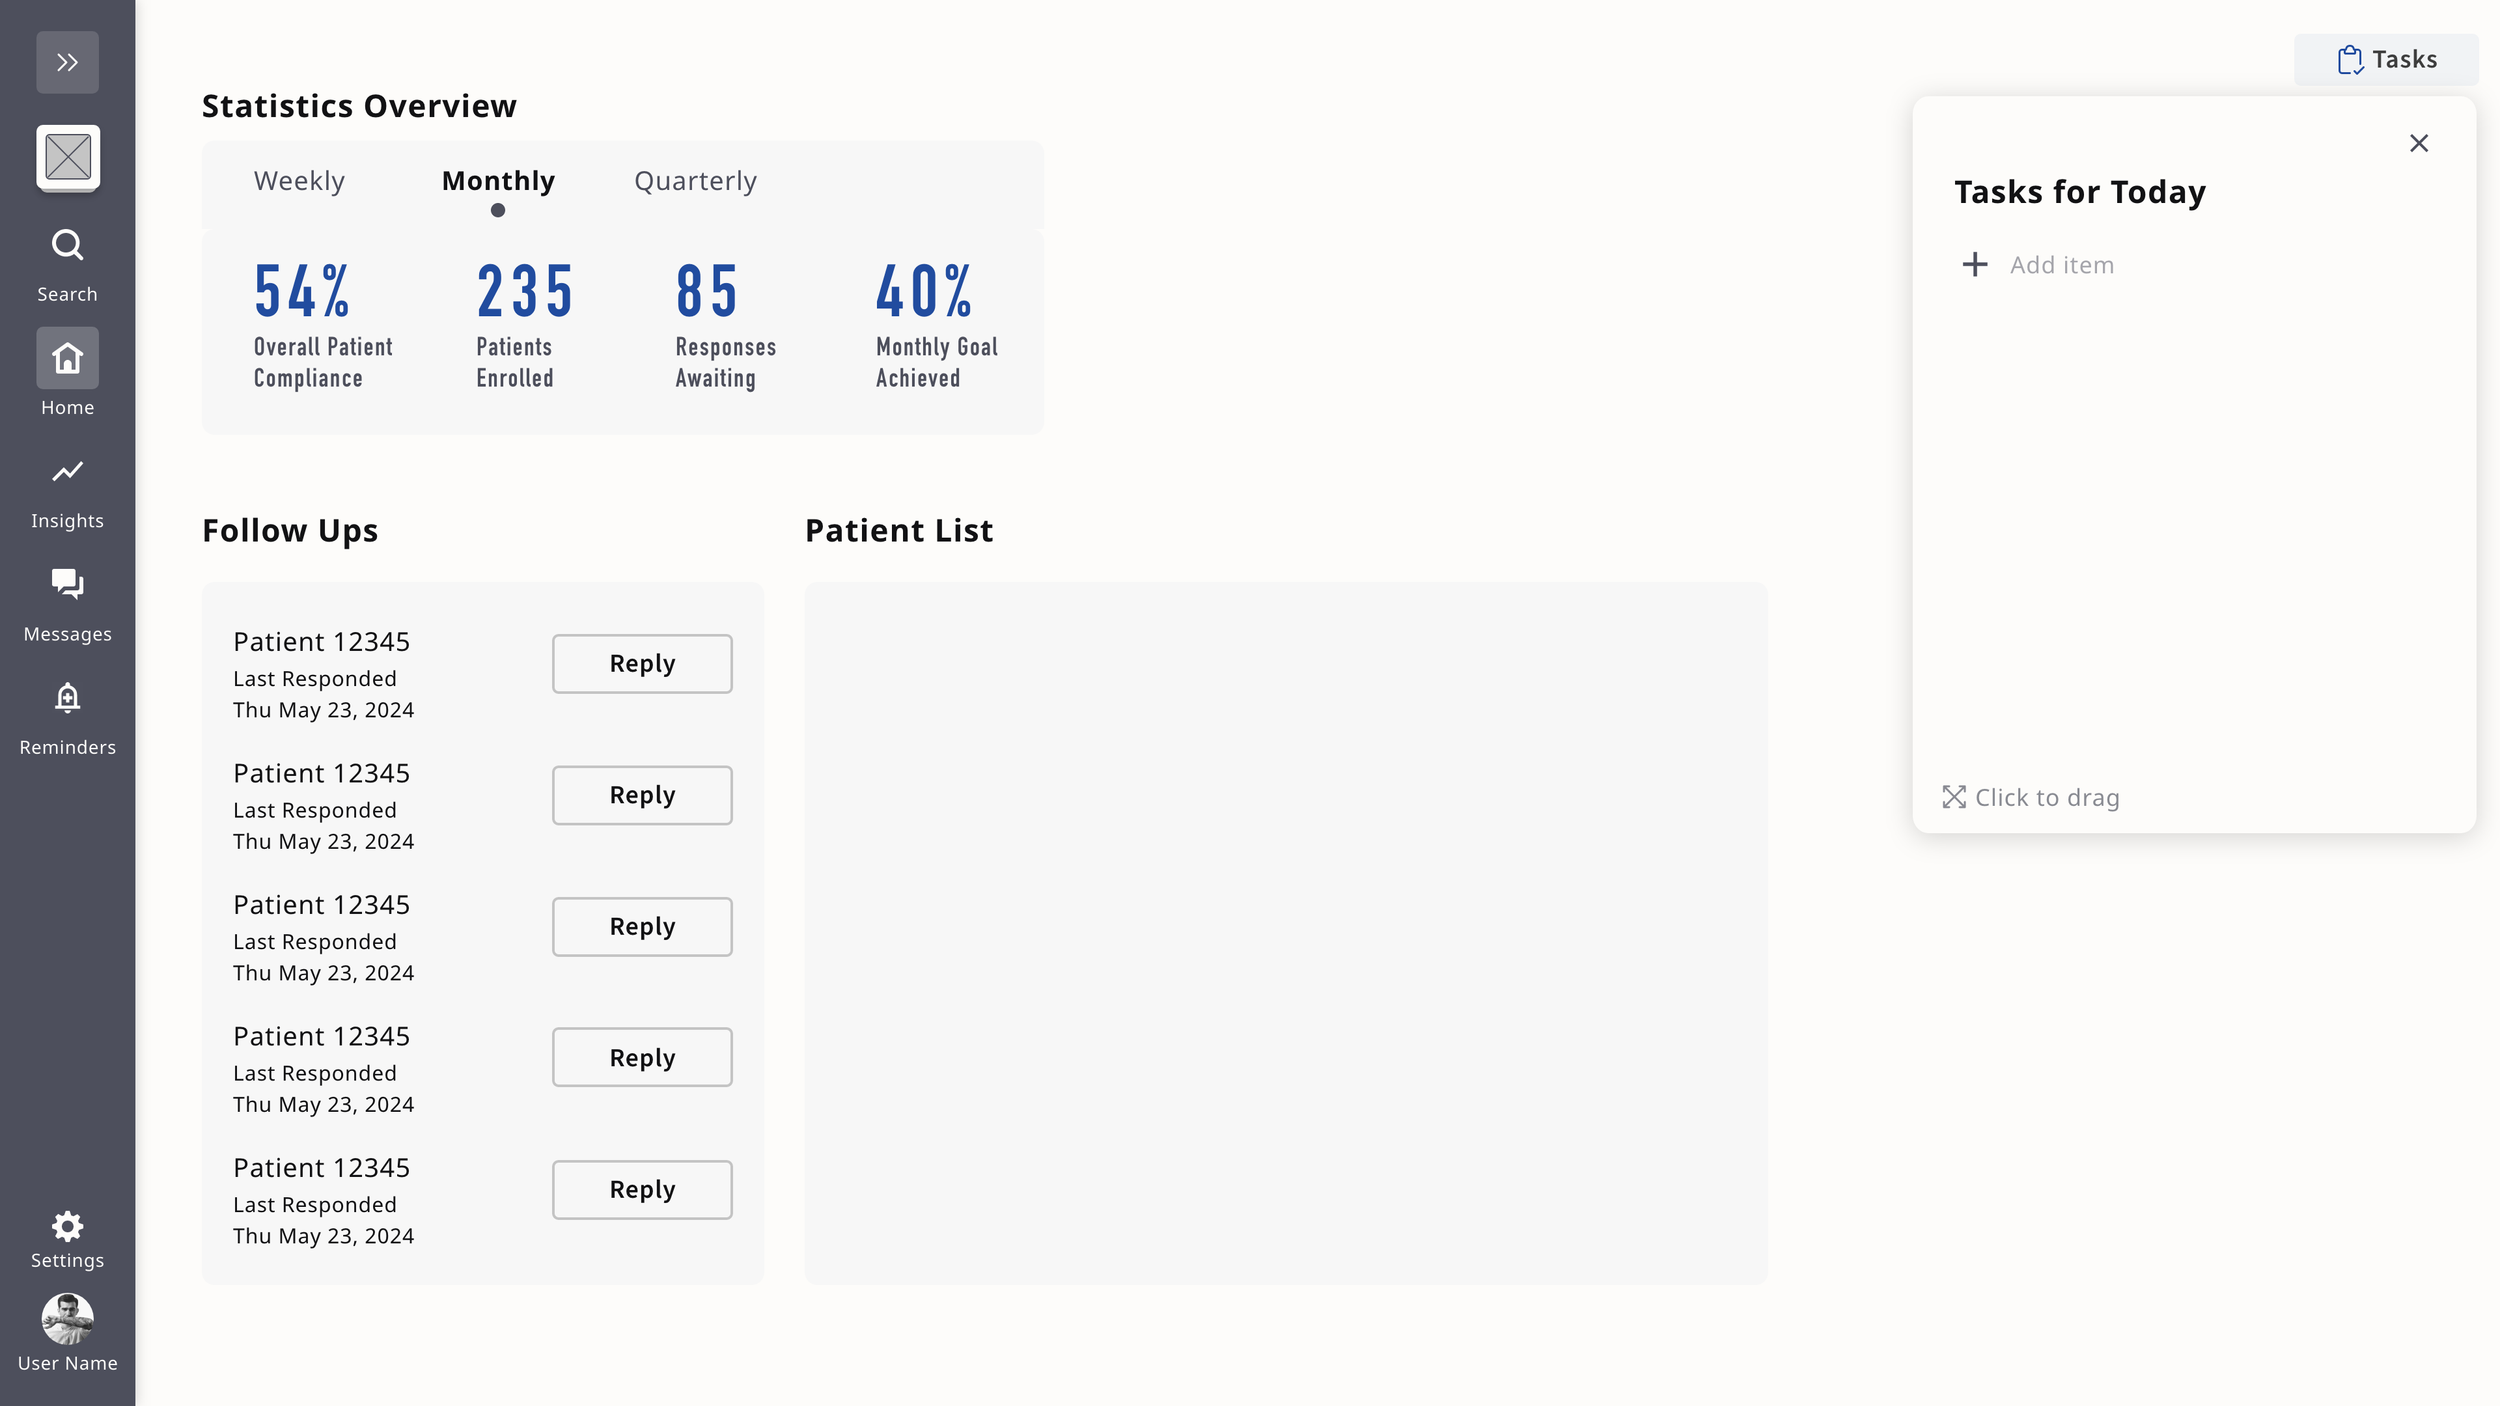
Side Drawer Feature
Iterate, Iterate, Iterate...
Iterate, Iterate, Iterate...

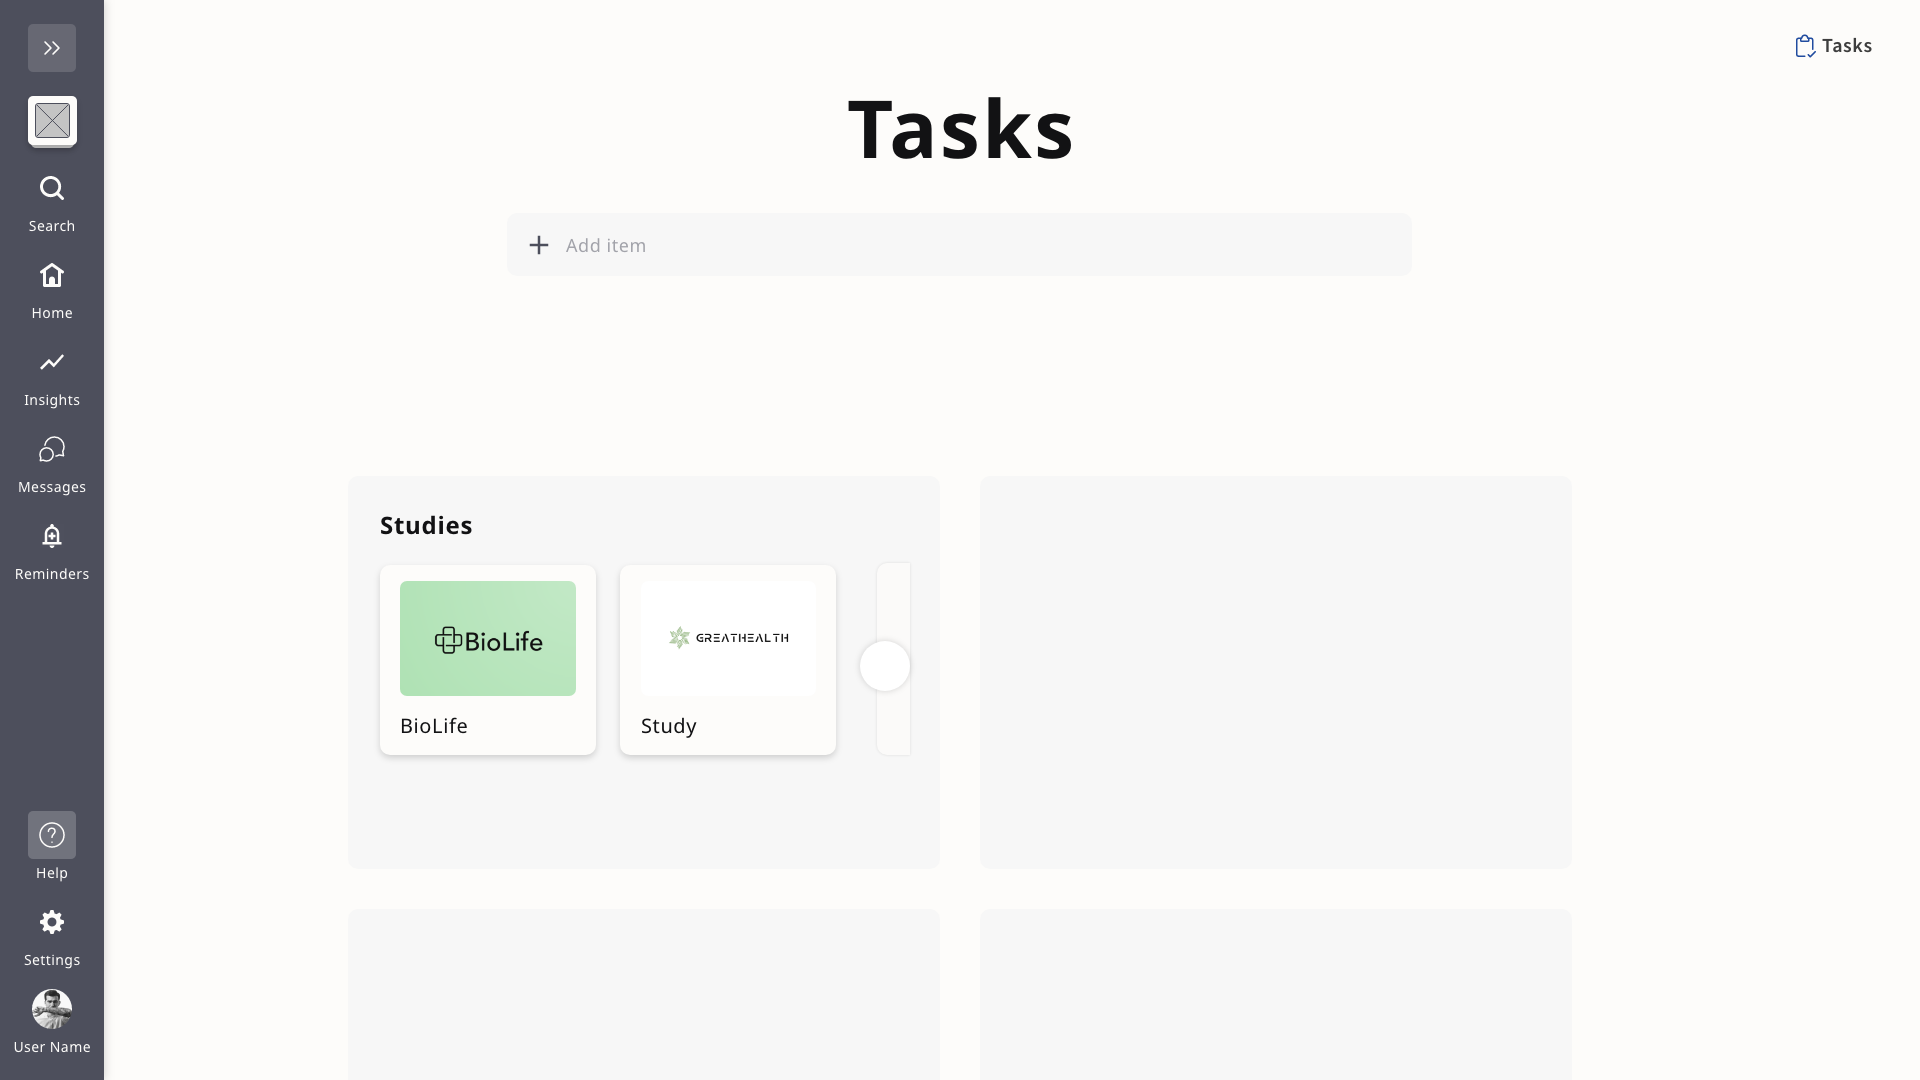
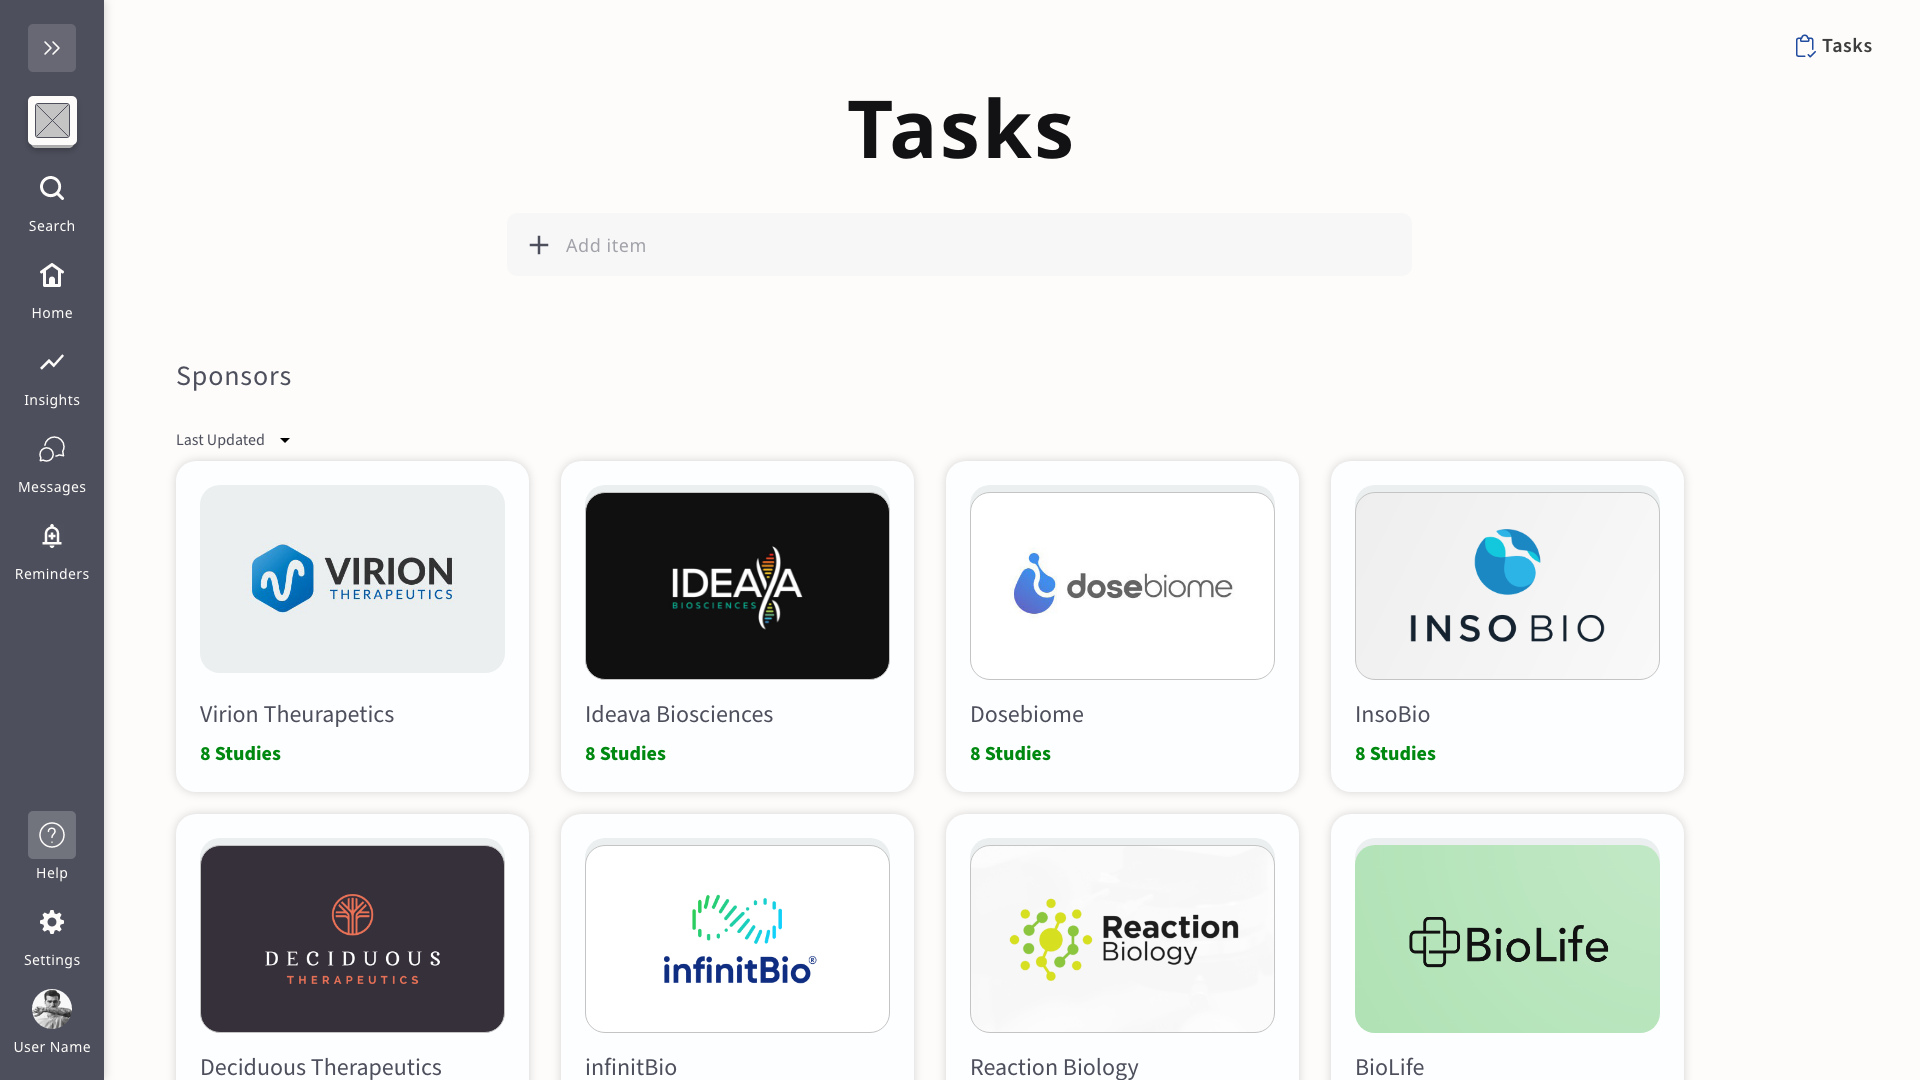
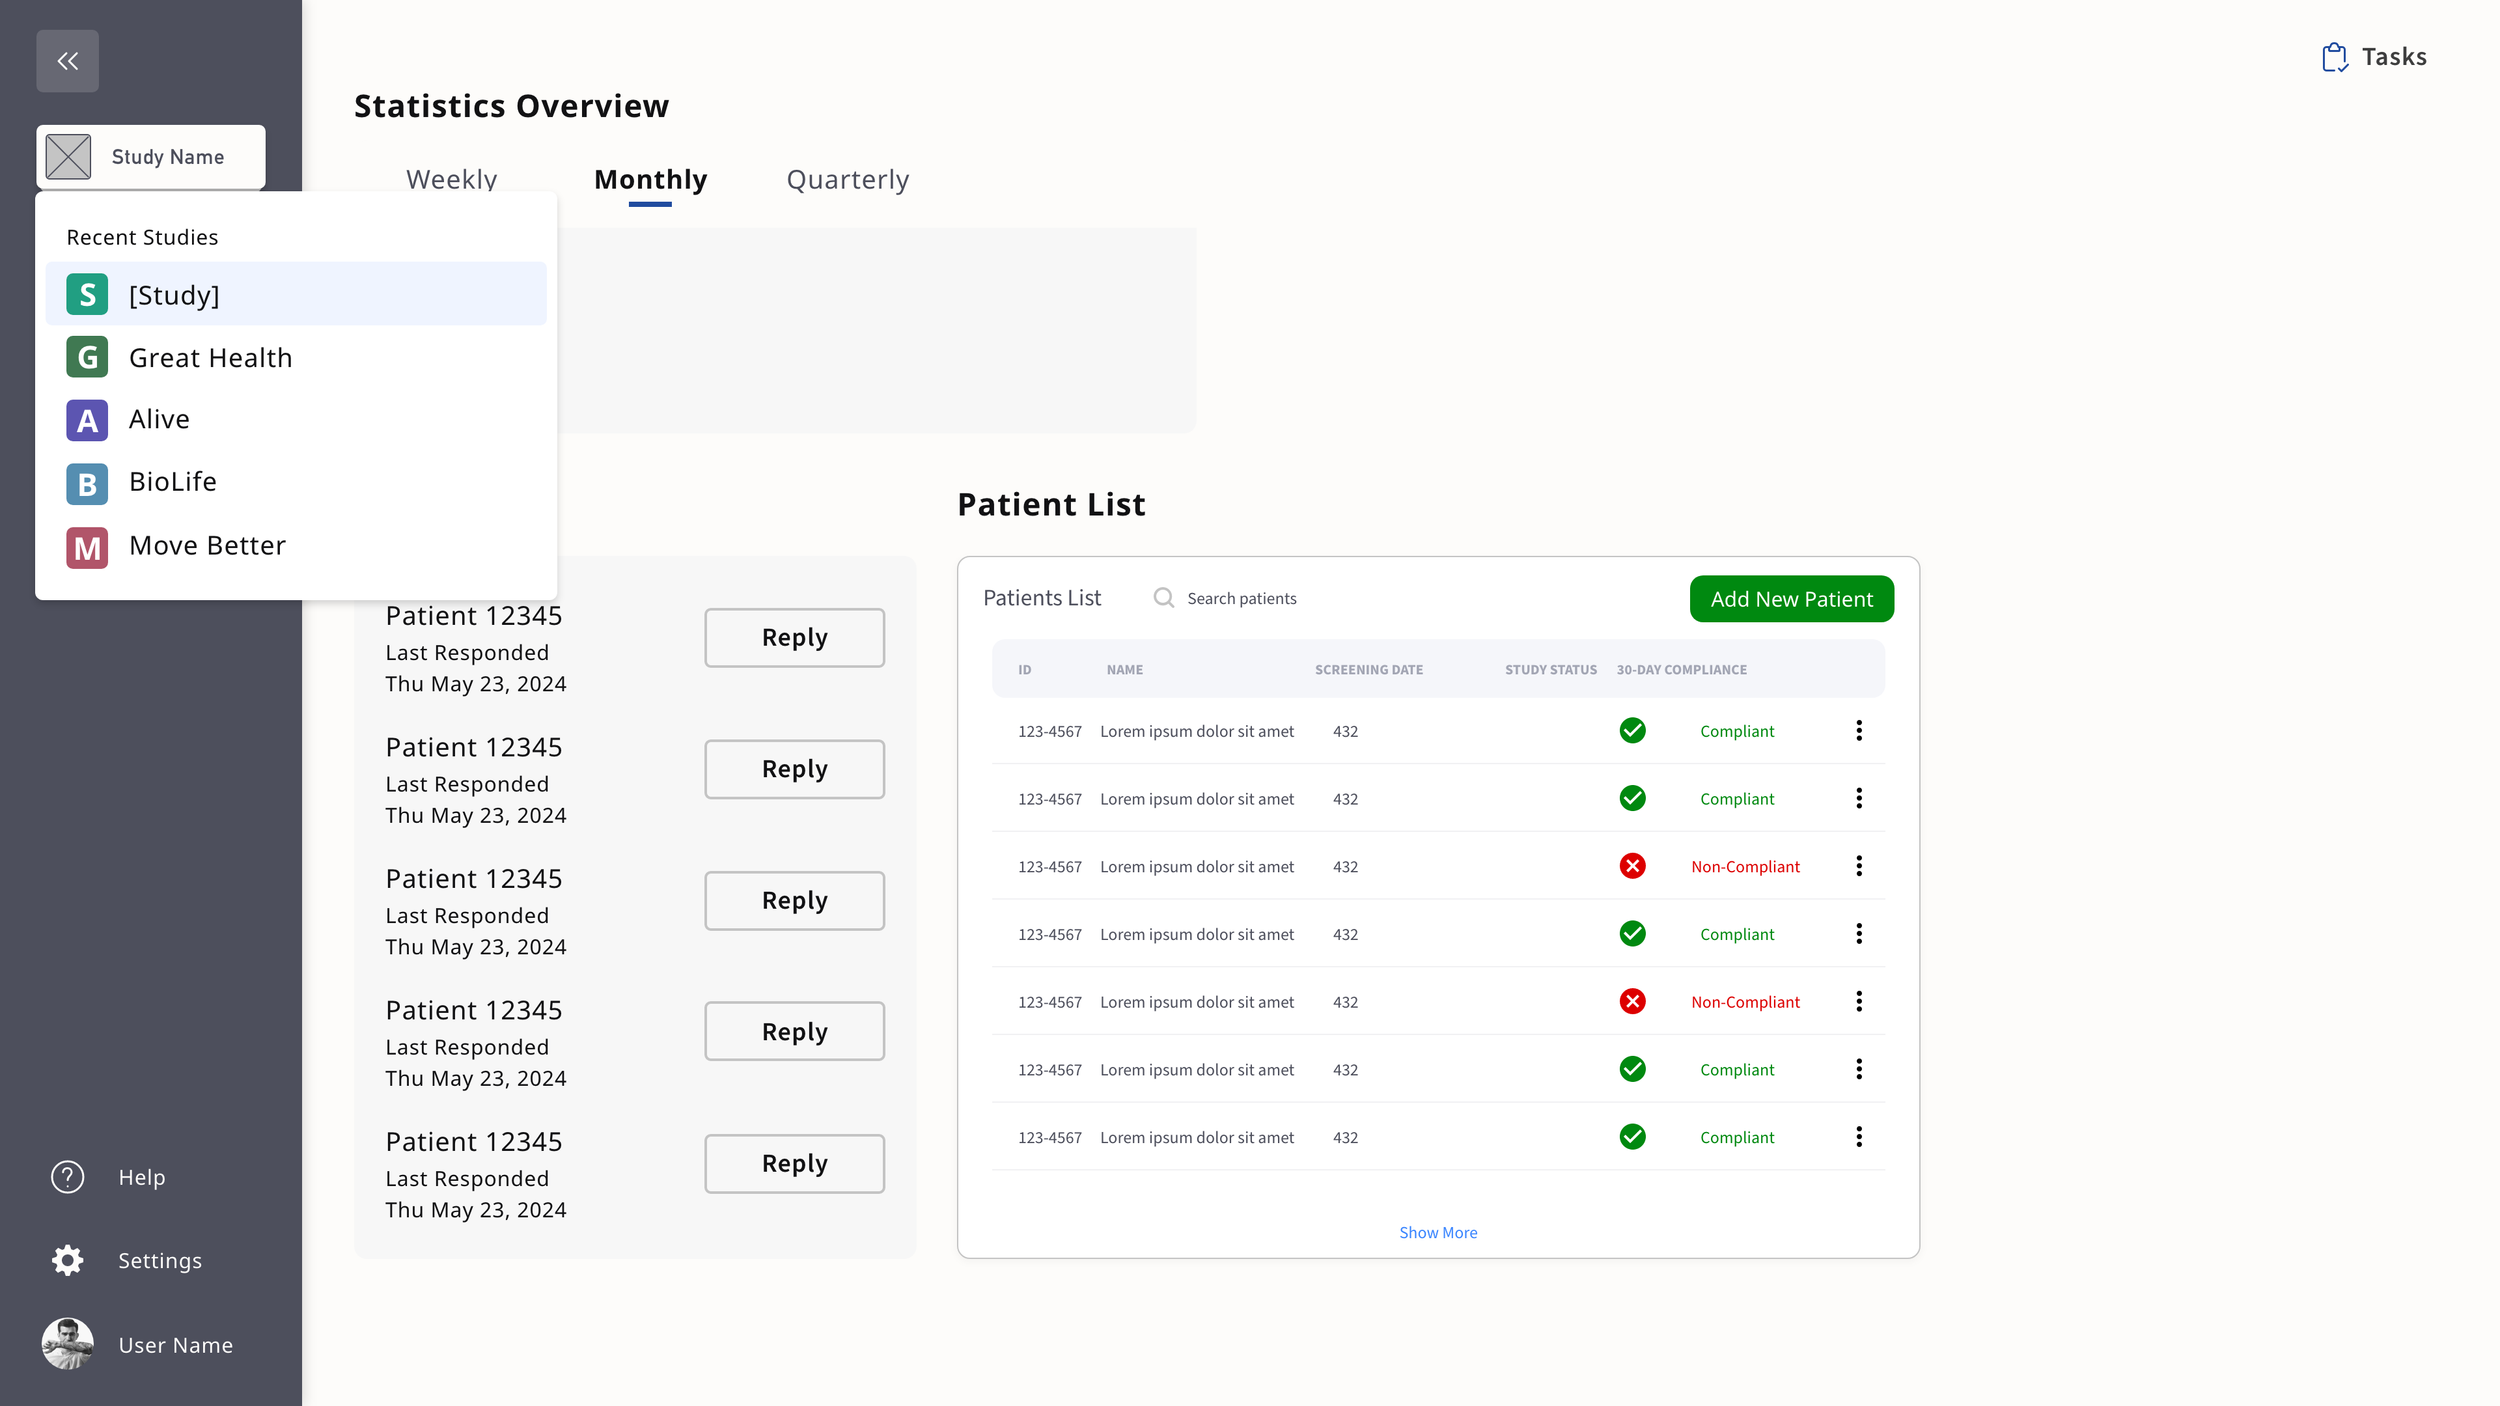
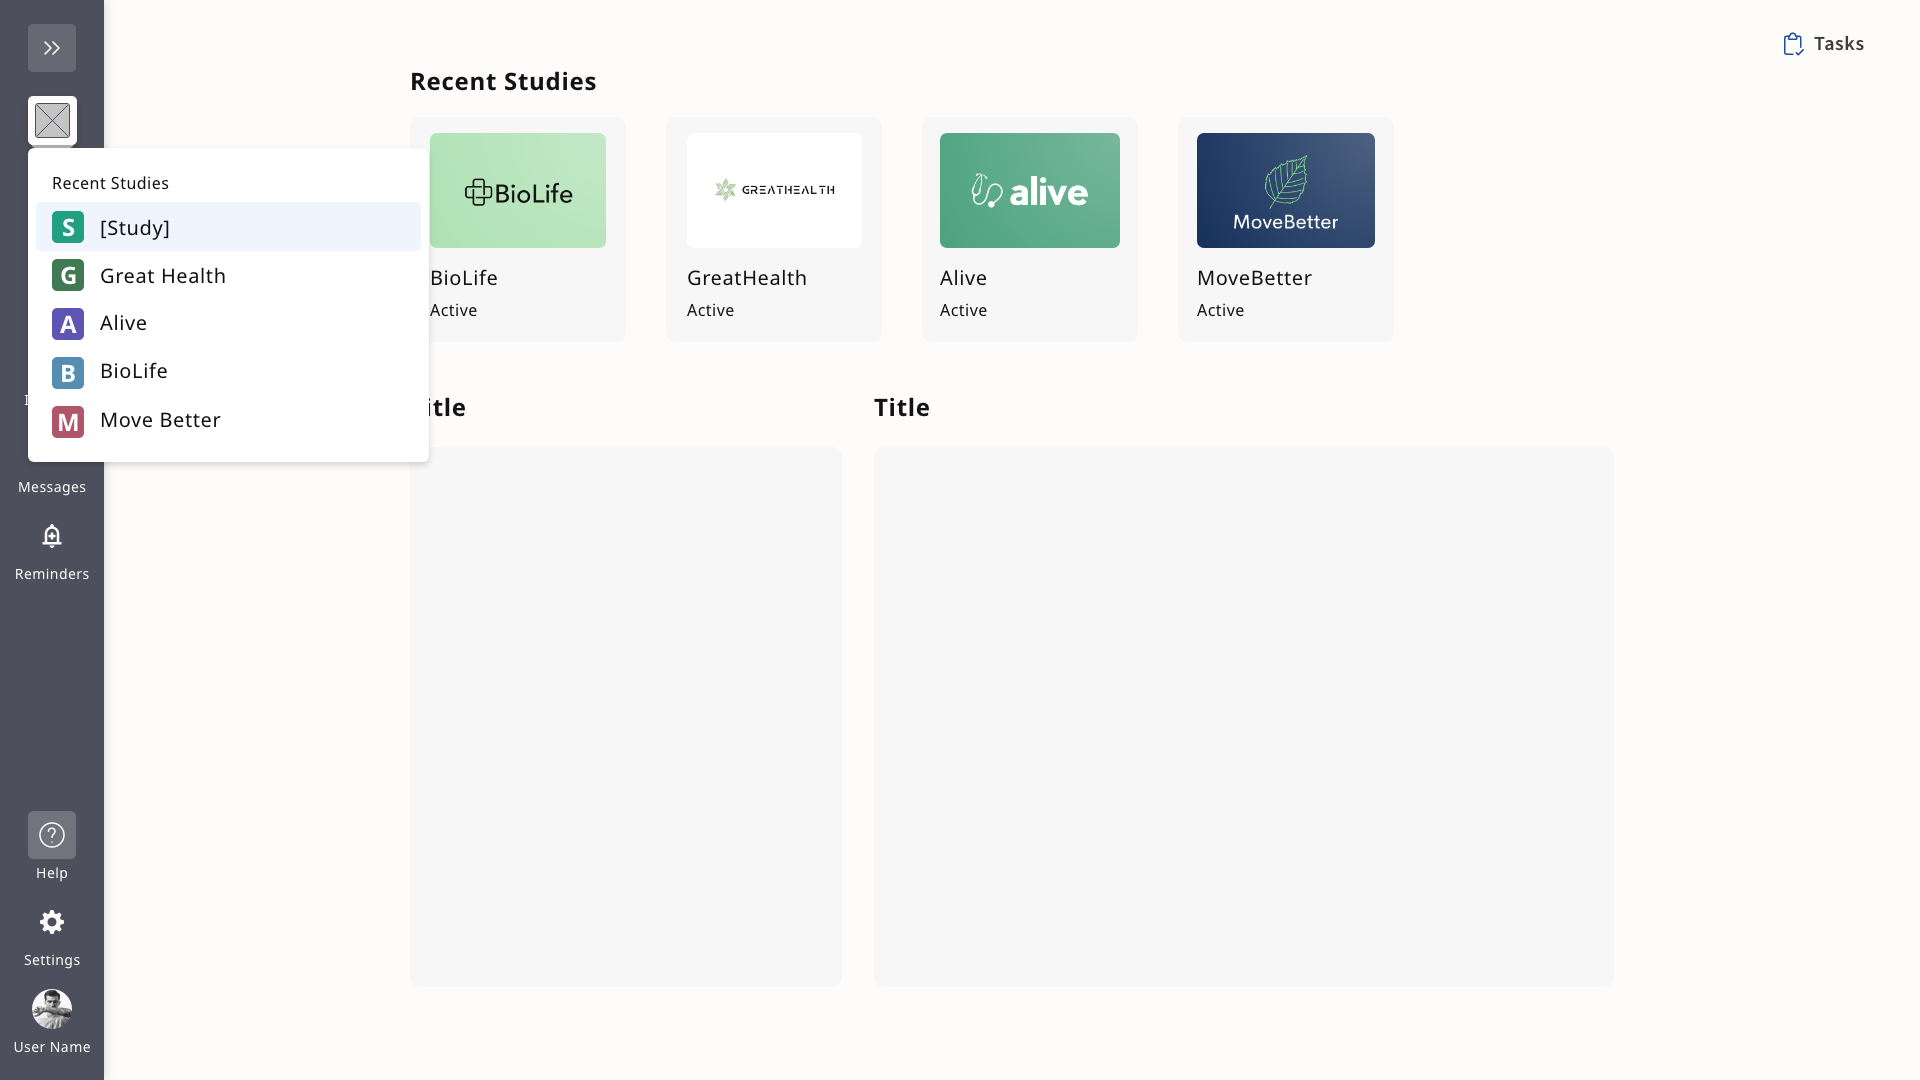
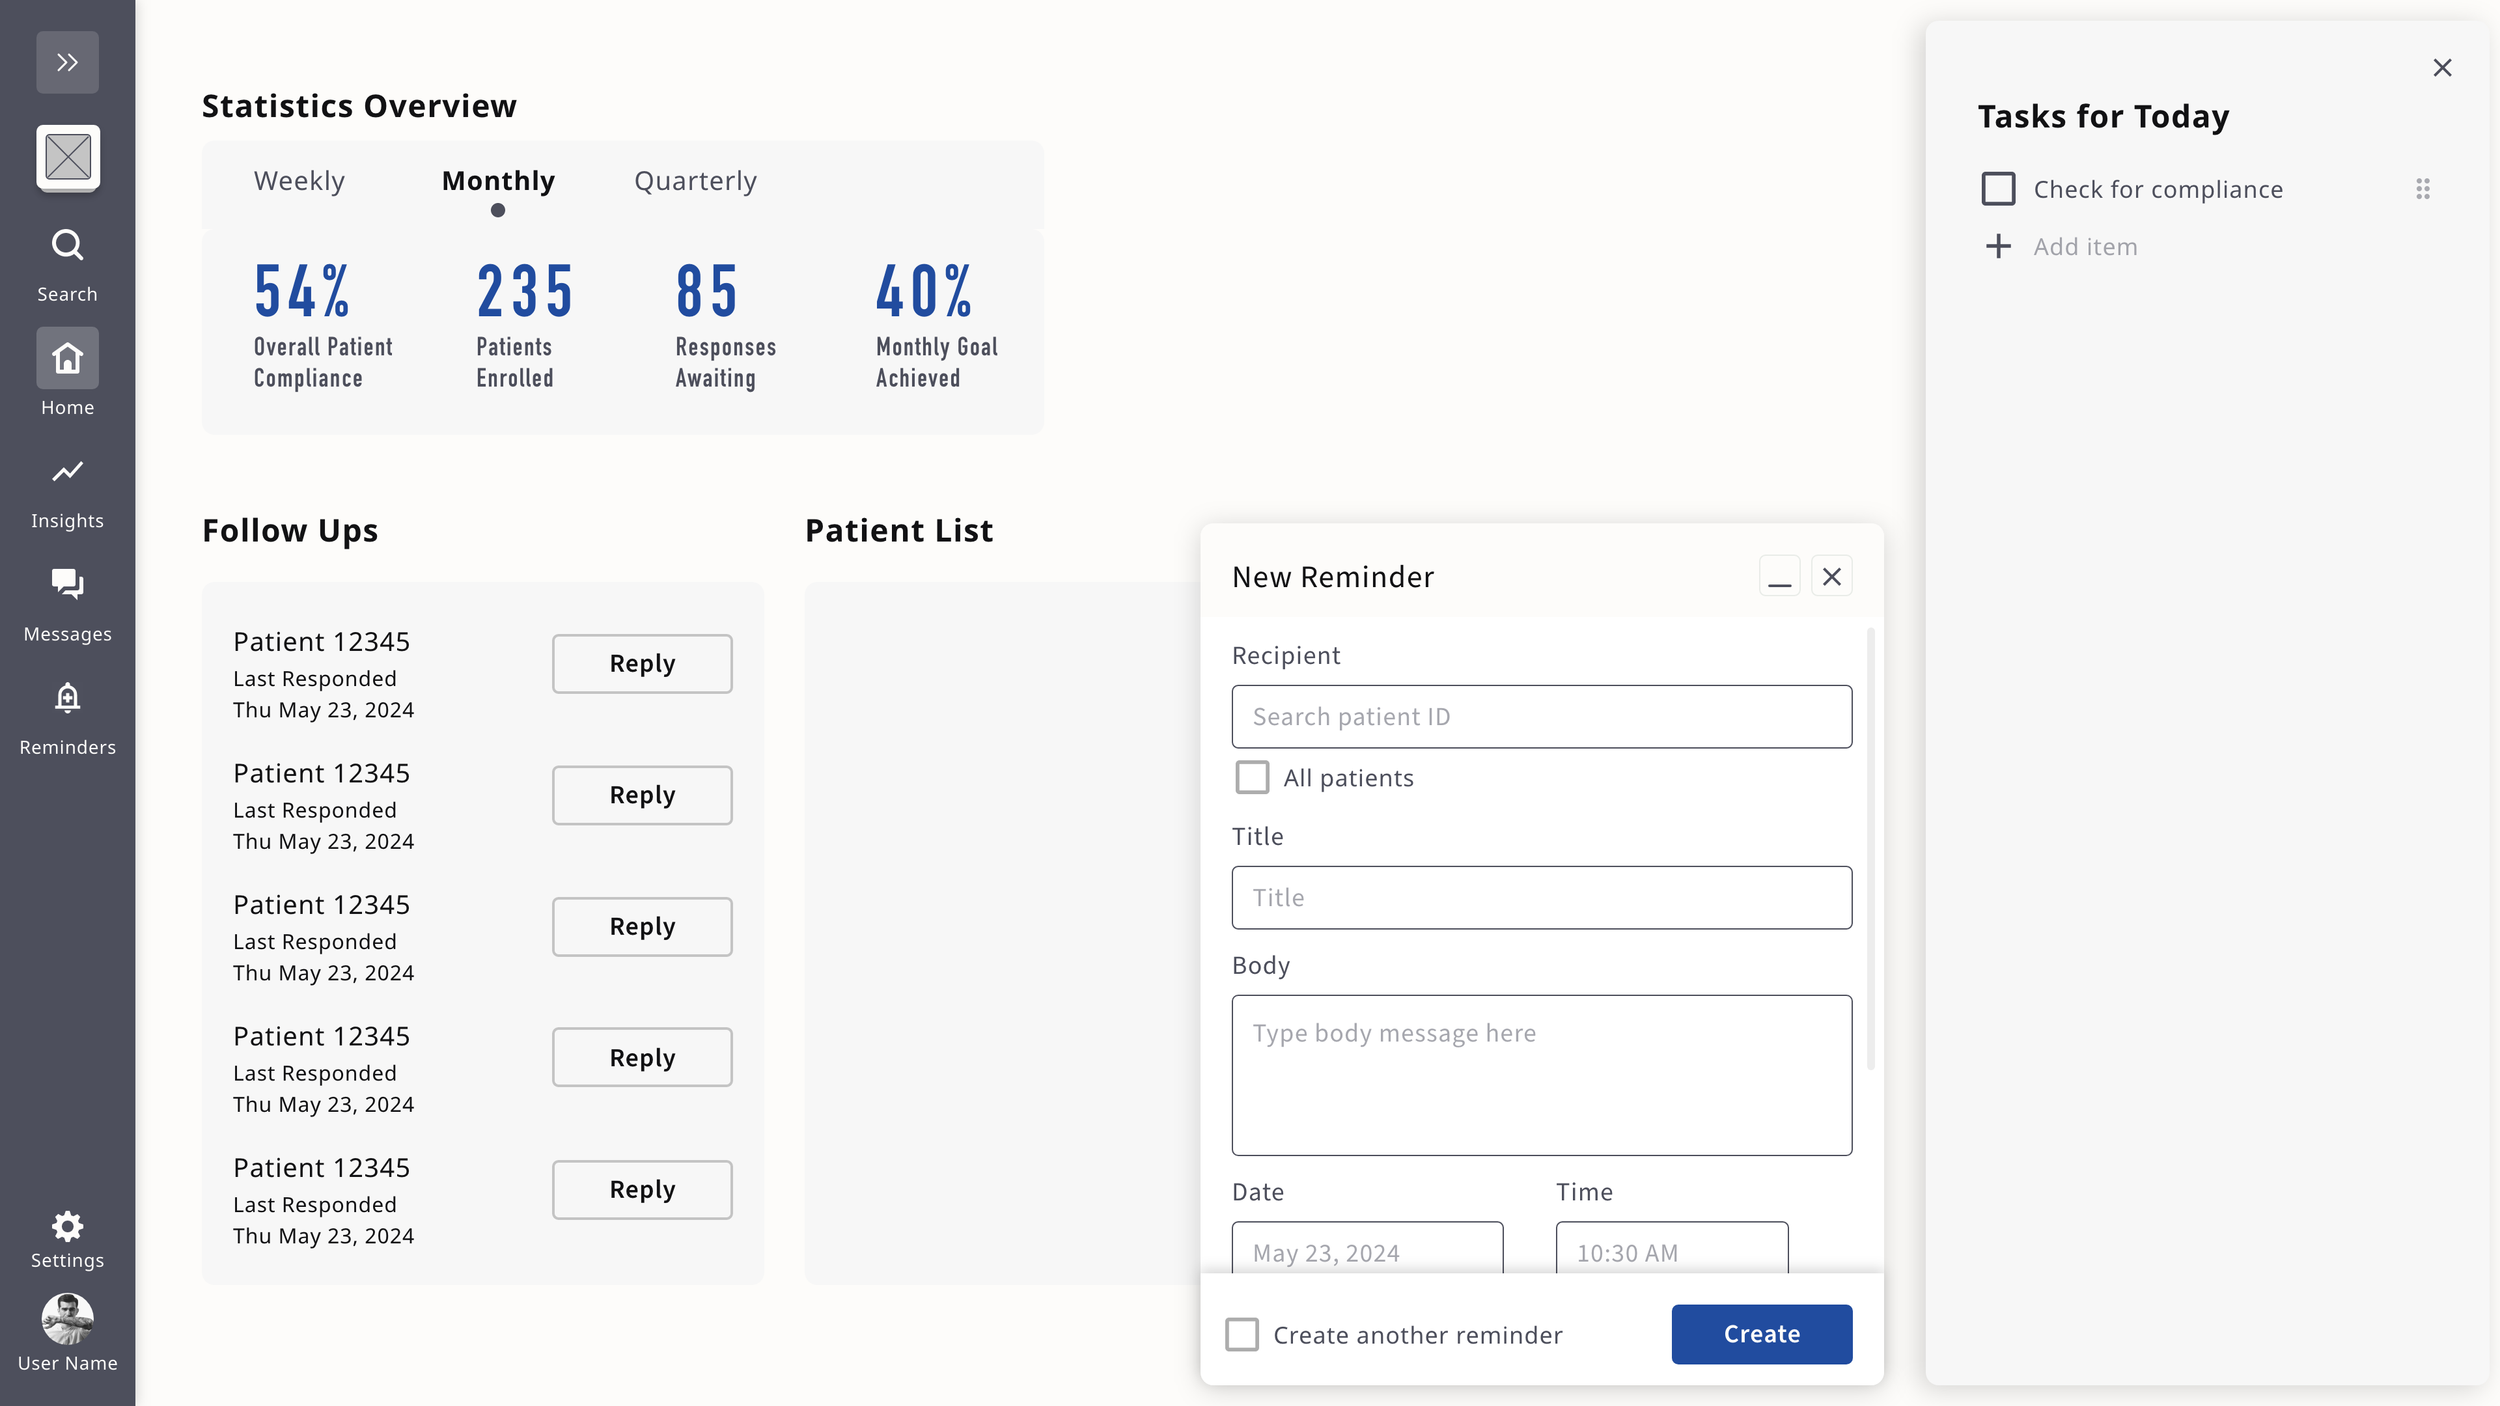
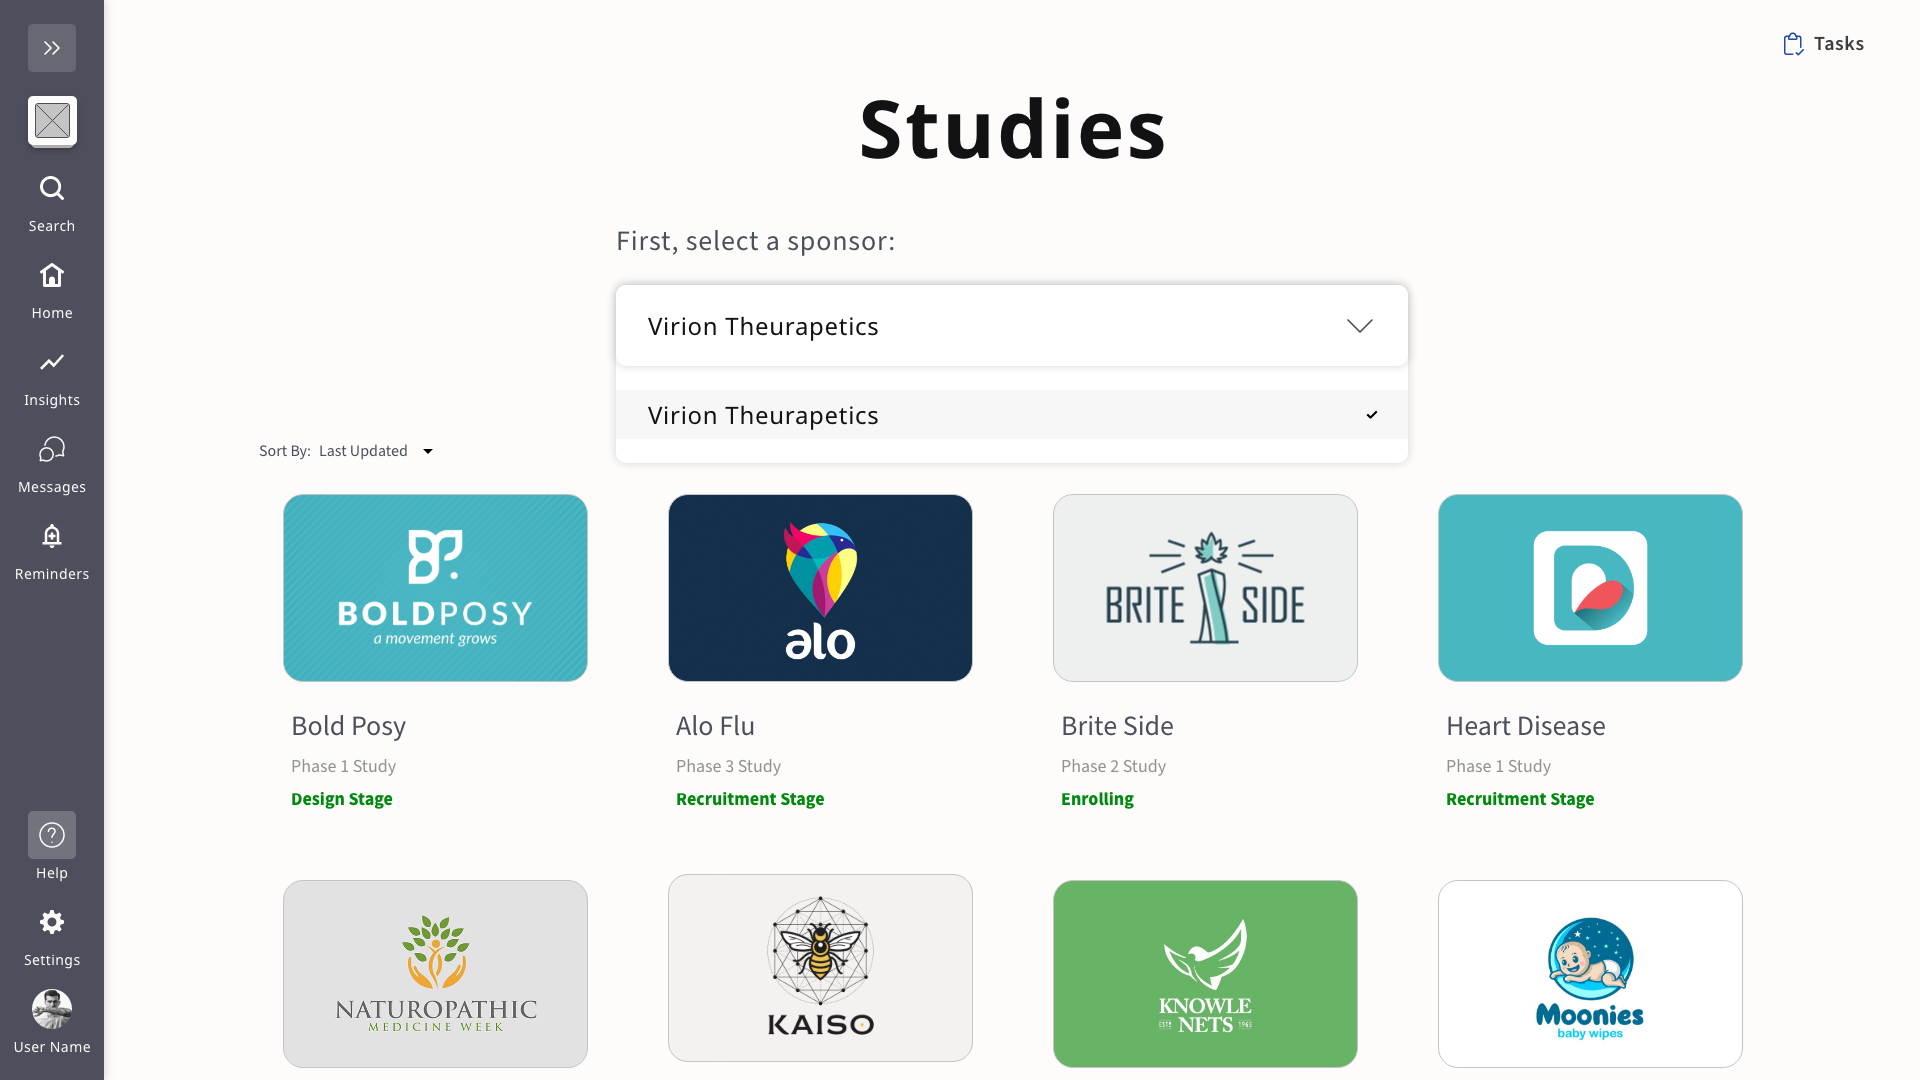
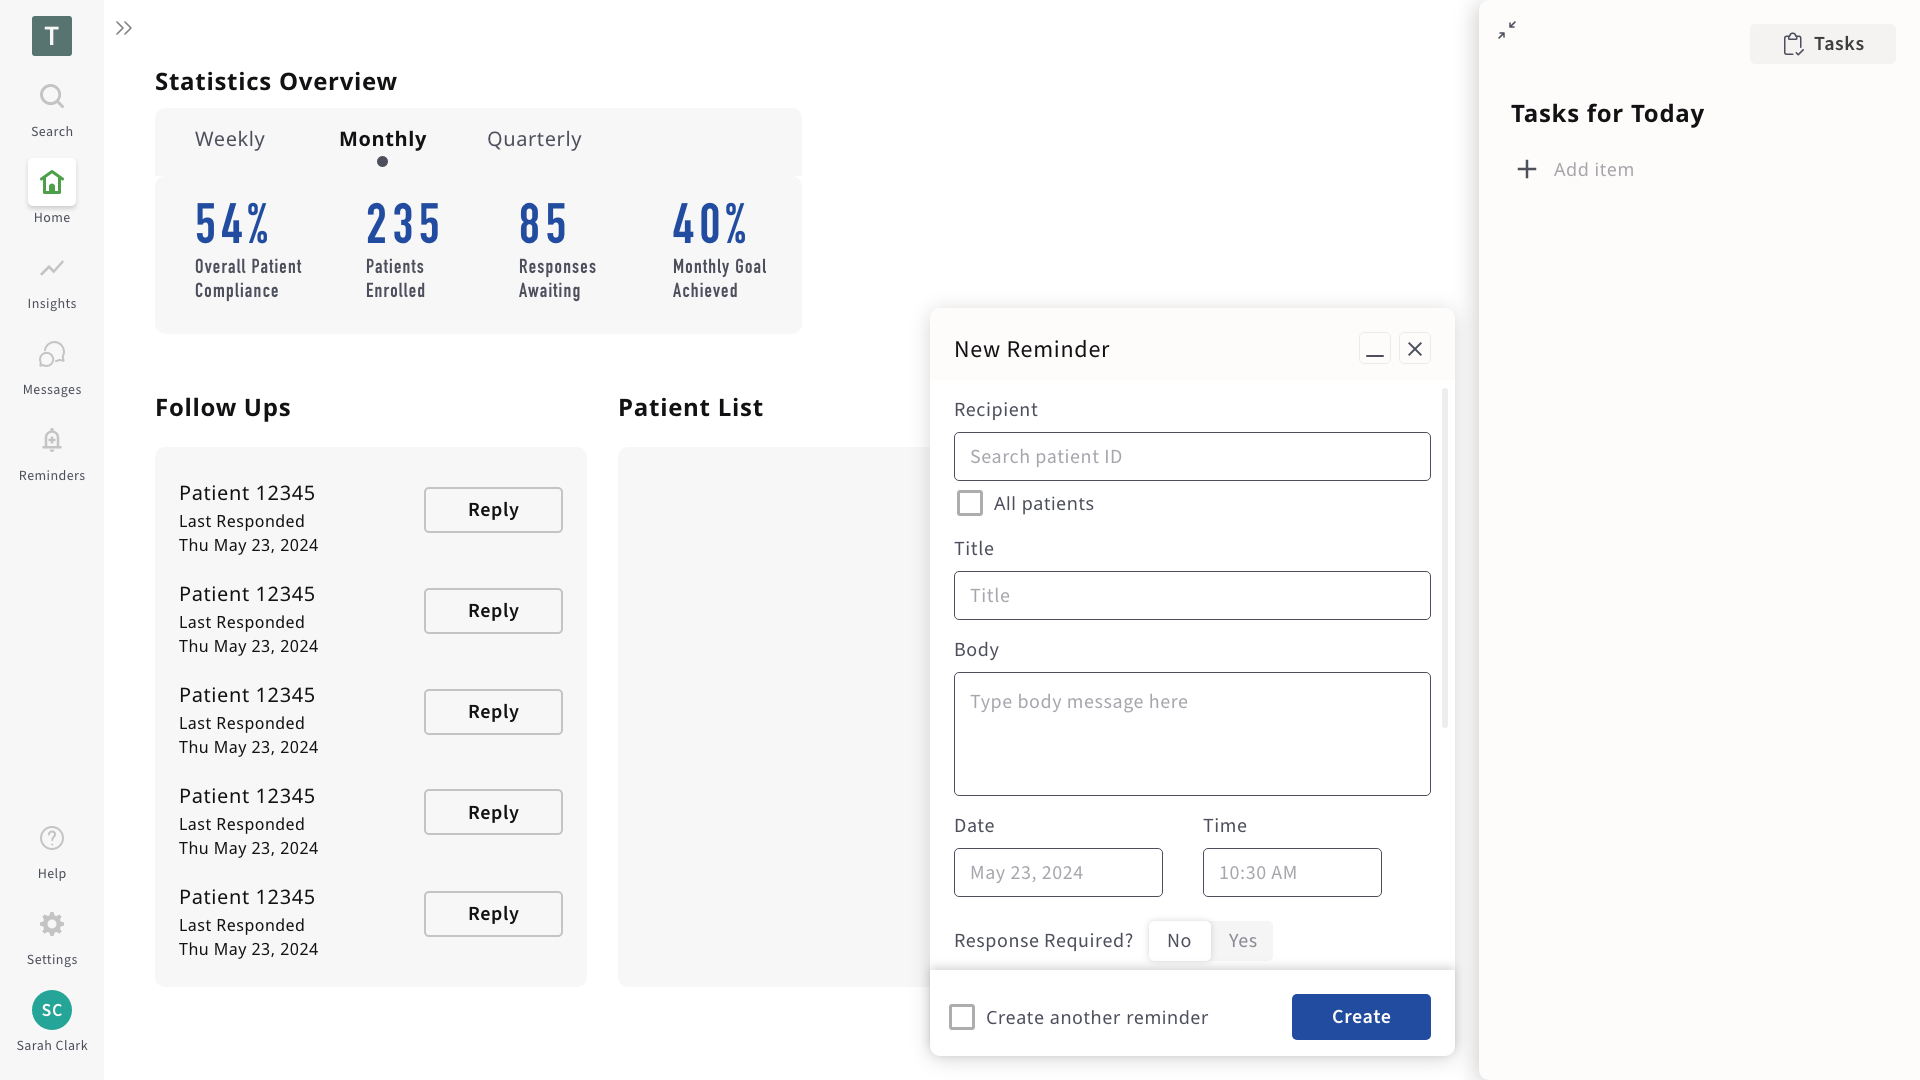
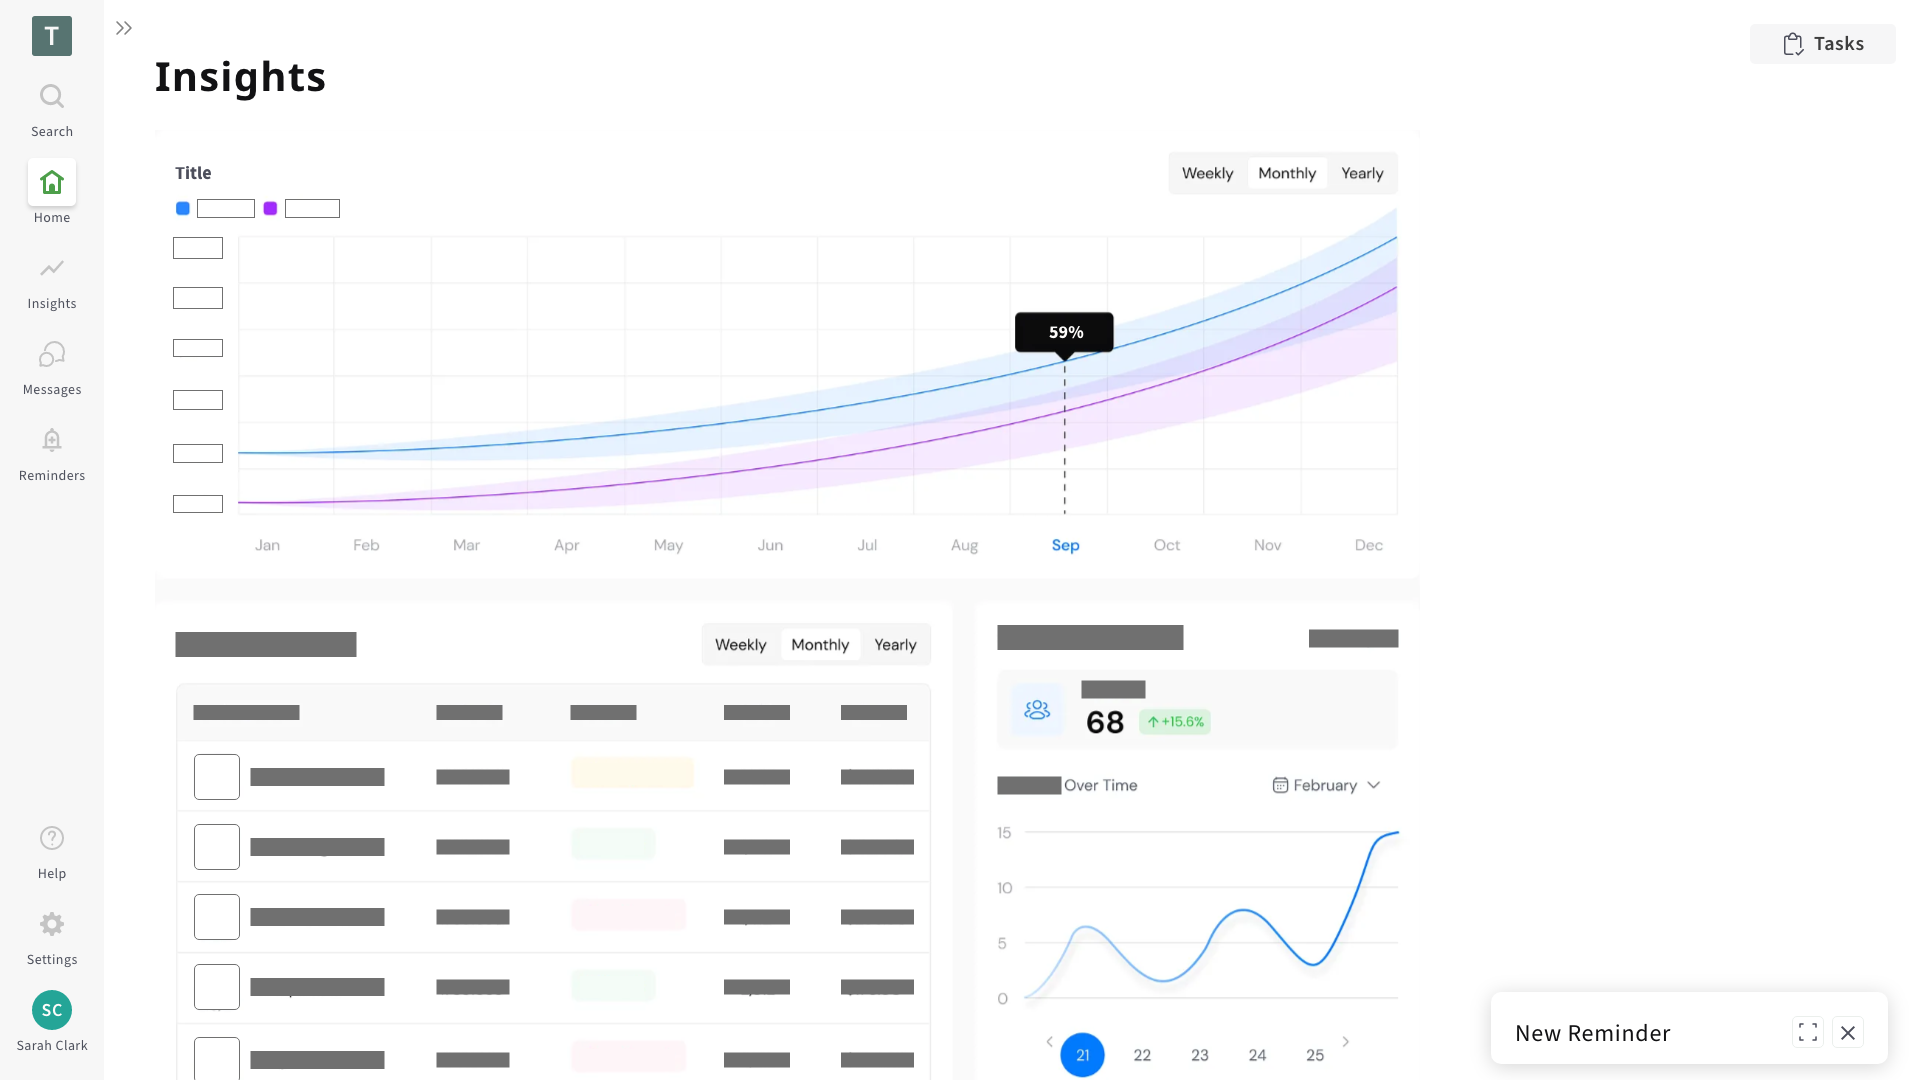
Showcase
Reflection
Iteration
Iteration was the highlight of this project as I conducted extensive research, sketched many ideas, and sought stakeholder feedback to determine the best dashboard format for the clinical research teams. Through this deep analysis of the pros and cons of other dashboard layouts, I narrowed it down to a clean dashboard with all of the necessary features.


→ Bridge Health
← Blueprint App